
Mortality statistics from the Australian Bureau of Statistics (“ABS”) show there never was a pandemic.
Except for a short period in 2020, 29 March to 12 April, the number of deaths due to all causes rarely ventured outside the usual high-low range for the previous five years – when they did the number was actually lower than the five-year average.
Then, in March 2021 deaths began to rise until in April they exceeded the March/April peak of the “2020 pandemic.” Two months prior to 2021 deaths reaching 2020 “pandemic” levels, Australia had launched its Covid injection campaign.
There will be those who claim the so-called “Covid pandemic” would have been “worse” if governments had not responded as they did – not restricted our rights and our liberties. But many studies, scientists and doctors have refuted that any of the responses – such as closure of businesses, closure of schools, “stay at home” orders, social distancing, masks, PCR testing – to control “the spread of the virus” would have any positive impact on any virus circulating in a population.
Anyone who feels this information is “breaking news” needs to research for themselves and stop relying on corporate media to present the facts. A good place to start is Dr. Michael Yeadon’s “8 Covid Lies” which he explains during an interview on The Highwire HERE.
As the following graphs show, based on the number of all-cause deaths, and looking back, history will find it difficult to determine which year the so-called “pandemic” actually occurred.
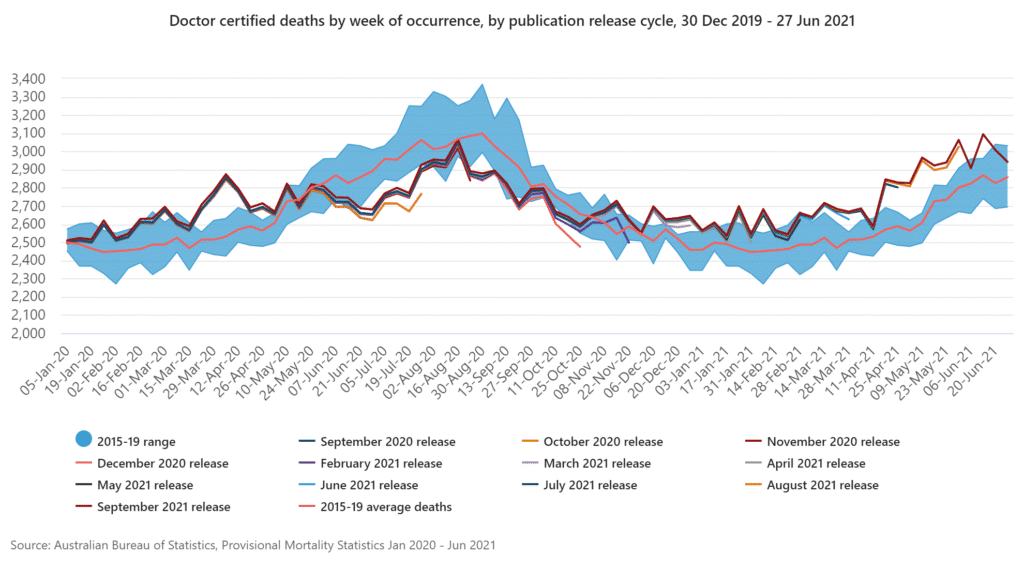
The graph below, prepared by the ABS, shows two periods of excess death: one peaking on 5 April 2020; and, the second beginning almost a year later between 14 March and 13 June 2021.
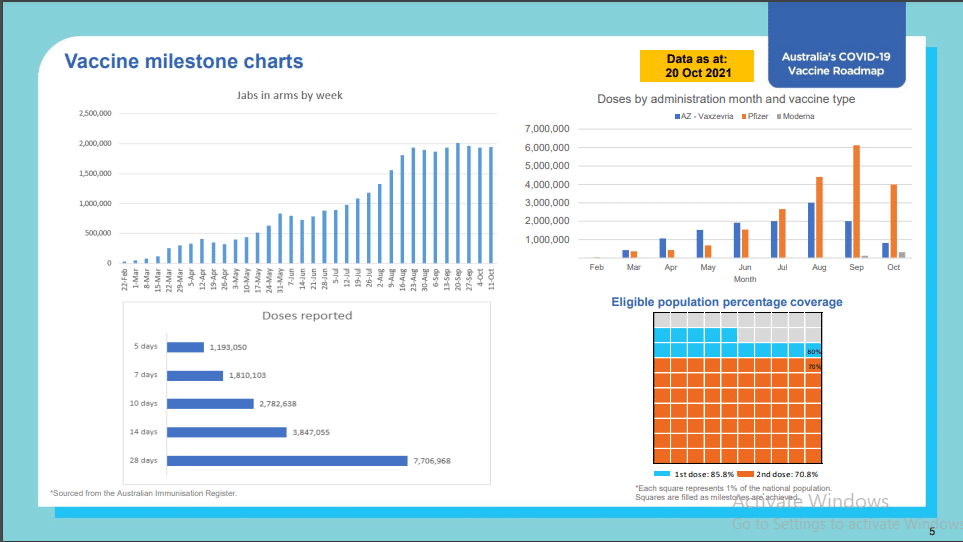
The image below, prepared by the Department of Health, is the latest update on the status of the injection roll-out. In Australia, the roll-out of Covid injections began on 21 February 2021. The elderly received injections first, prioritising those in care homes. Eight months later, as of 21 October 2021, 33,5 million doses had been administered in a country with a population of 25,9 million.
To enable a simple comparison of all-cause mortality and vaccine roll-out, we combined the two data sets to produce two graphs. One representing cumulative figures and a second for data “per week.” In the name of transparency, we have attached the data we used to produce these graphs.
Note: Provisional mortality statistics are only available up to the end of June so the graphs show statistics for the six-month period Jan – June.
There is no mention to the contrary so we are assuming the numbers of deaths are absolute. We have made no attempt to adjust the data to account for changes in demographics or changes in population levels over the years. For example, in 2015 the population of Australia was 23,9 million and in 2021 25,9 million – a 6.5% increase – and the higher the population the higher the absolute number of deaths.
The Department of Health data only shows cumulative totals in any particular data update file so we used weekly data extracted from covid19data.com.au – an independent and voluntarily maintained website which captures the announcements and representations made to the Australian public. At the time of retrieval of data, the total injection doses per the Department of Health and covid19data were precisely the same, 33,489,485.
Our first graph shows the cumulative totals for the first half of the year. From the start cumulative number of deaths in 2021 are marginally higher than 2020 but they become visibly higher from mid-March. And from mid-May the gap between 2021 and 2020 and the 2015-19 five-year average grows wider.
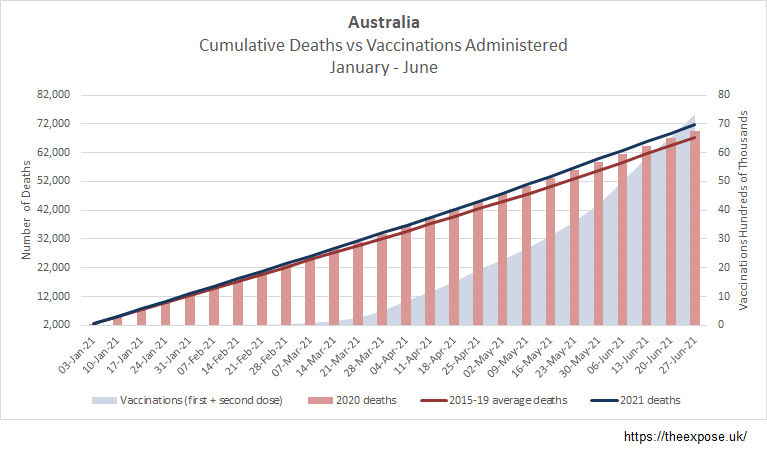
Source: Provisional Mortality Statistics, Australian Bureau of Statistics and COVID-19 Vaccinations in Australia, covid19data.com.au, retrieved 21 October 2021
The 2021 and 2020 gap is notable for two reasons.
Firstly, during 2020 we were told there was a global pandemic. A pandemic should cause between 5 and 50 times more deaths than usual. Although it should be noted, the number of deaths during 2020 were marginally higher (3.6%) than the average for the preceding 5 years but they were certainly nowhere near pandemic levels, put simply, there was no pandemic in Australia during 2020.
Secondly, in 2021 a so-called anti-Covid “vaccine” was rolled-out. We were told this injection would prevent serious illness and death, some “vaccines” claiming a 90%+ efficacy. Yet for the first six months of 2021, compared to 2020, there were 2,087 (3%) more deaths. More deaths in a year during which there was mass “vaccination” than in the year of a deadly global pandemic.
If there was a pandemic and the vaccines were “safe and effective” we would expect statistics to show between 5 and 50 times fewer deaths. Based on the six-month “2020 pandemic” total of 70 thousand deaths we would expect, as a conservative guess, a saving of one or two hundred thousand lives. The actual number – whether half, one, two or three times the usual deaths – becomes irrelevant as there is a “pre-pandemic” average of 67 thousand deaths a year. It is not possible to have negative deaths and no government or their advisors could convince any sane person that a country could have zero all-cause deaths at any given time, even with a miracle “vaccine.”
Our second graph shows the same data as the first but totals deaths and vaccinations “per week” rather than weekly accumulating totals. There is a clear spike in deaths in 2020 peeking on the 4 April but otherwise the number of deaths in 2020 is lower than 2021 in the majority of weeks. The number of deaths becomes consistently and noticeably higher in 2021 from 18 April onwards. It’s notable that the rise in 2021 deaths follows a similar rise in vaccinations administered.
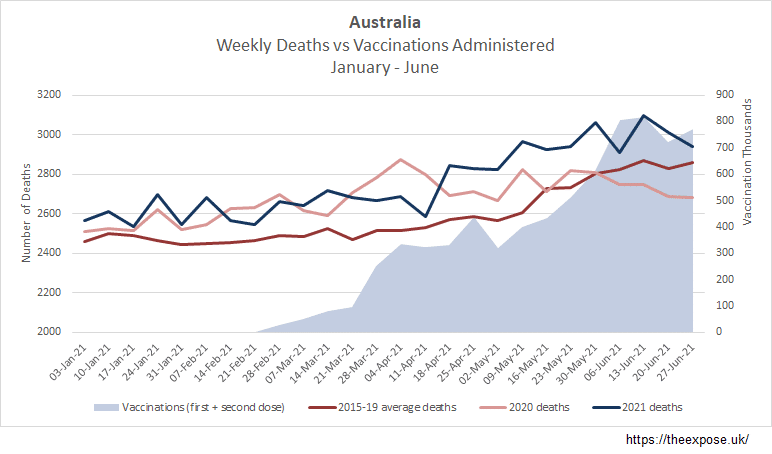
Source: Provisional Mortality Statistics, Australian Bureau of Statistics and COVID-19 Vaccinations in Australia, covid19data.com.au, retrieved 21 October 2021
The accumulation of the higher “per week” totals from mid-April will be what is underlying the widening visible gap seen in the cumulative totals (first graph) from mid-May. In other words, the 2021 excess deaths are large enough to be noticeable on the total half-yearly all-cause deaths. We mentioned earlier that, overall, 2020 was 3.6% higher than the preceding five-year average and 2021 was 3% higher than 2020. It follows that 2021 is 6.7% higher than the 2015-19 five-year average. If there ever was a pandemic during 2020, its effects have doubled in 2021.
The next question is, why are the number of deaths, year on year, higher in 2021?
We will dig into the statistics a little more but it will likely raise more questions rather than provide answers. It is worth noting that the vaccine roll-out began in late February 2021 and by 18 April, when number of deaths became noticeably and consistently higher, 1,5 million doses of Covid injections had been administered. By the end of June, 7,3 million doses had been administered and total number of deaths, for the first half of the year, were the highest they have been for 7 years. Which leads to another question, is the Australian government vaccinating people to death?
The Expose Urgently Needs Your Help…
Can you please help to keep the lights on with The Expose’s honest, reliable, powerful and truthful journalism?
Your Government & Big Tech organisations
try to silence & shut down The Expose.
So we need your help to ensure
we can continue to bring you the
facts the mainstream refuses to.
The government does not fund us
to publish lies and propaganda on their
behalf like the Mainstream Media.
Instead, we rely solely on your support. So
please support us in our efforts to bring
you honest, reliable, investigative journalism
today. It’s secure, quick and easy.
Please choose your preferred method below to show your support.
Categories: Breaking News, Latest News, World News
Your alternative update on #COVID19 for 2021-10-20. Jab is biggest dud in medicine’s history. QR Codification of World. Drs & Crimes against Humanity
https://paulthepaperbear.wordpress.com/2021/10/20/your-alternative-update-on-covid19-for-2021-10-20-jab-is-biggest-dud-in-medicines-history-qr-codification-of-world-drs-crimes-against-humanity/
Seven, i.e. only 7 have died in Qld since the outbreak 21 months ago… so that averages one death every three months! They can’t call out, “bring out ya dead” because the carts are empty.