
Official figures published by the UK’s Office for National Statistics show that deaths per 100,000 among double vaccinated 18-39-year-olds were on average 91% higher than deaths per 100,000 among unvaccinated 18-39-year-olds between January 2021 and January 2022.
This means it can no longer be denied that the Covid-19 vaccines are deadly because even the official Government published figures now prove it.
Let’s not lose touch…Your Government and Big Tech are actively trying to censor the information reported by The Exposé to serve their own needs. Subscribe to our emails now to make sure you receive the latest uncensored news in your inbox…
The Office for National Statistics is the UK’s largest independent producer of official statistics and the recognised national statistical institute of the UK. It is responsible for collecting and publishing statistics related to the economy, population and society at national, regional and local levels.
Its dataset on deaths in England by vaccination status between January 2021 and January 2022 can be found here. It contains a large amount of data on age-standardised mortality rates for deaths by vaccination status between 1 January 2021 and 31 January 2022.
Table 2 of the dataset contains data on the monthly age-standardised mortality rates by vaccination status by age group for all deaths in England. The following table shows an example of how the numbers are presented in the dataset –
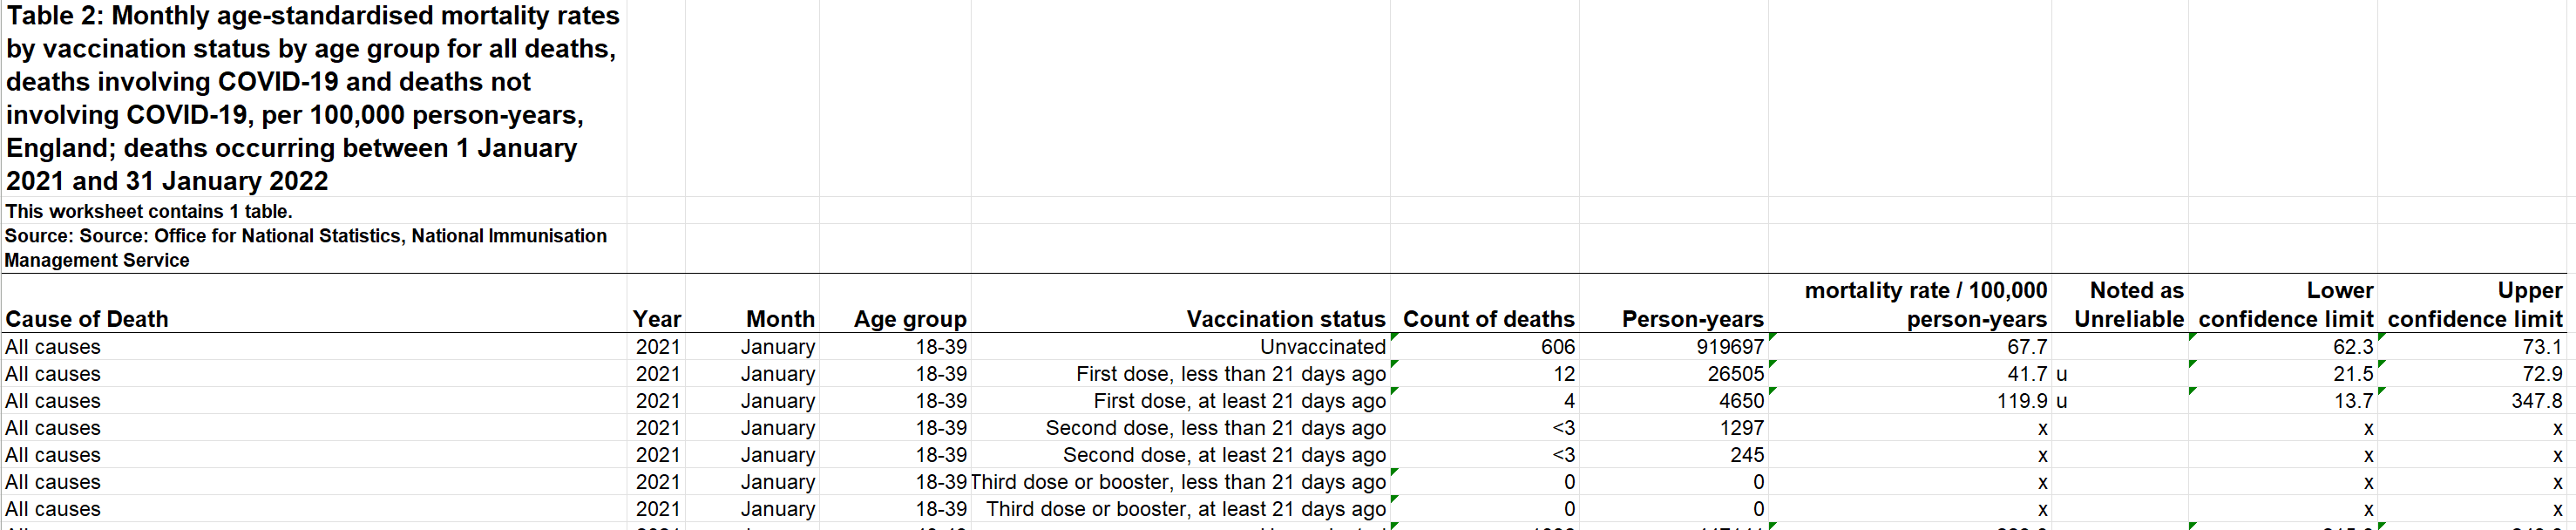
What immediately catches the eye when looking at this data is the mortality rate per 100,00 person-years among 18-39-year-olds in the month of January 2021. The figures show the death rate among the unvaccinated in this month was 67.7 deaths per 100,000 person-years. Whilst the death rate among the partly vaccinated (at least 21 days ago) was 119.9 deaths per 100,000 years.
This shows that vaccinated 18-39-year-olds were more likely to die in January 2021, suggesting the Covid-19 injections increased the risk of death or played a part in causing death. So we dug further and extracted all the figures on 18-39-year-olds for each month between January 2021 and January 2022, and this is what we found –
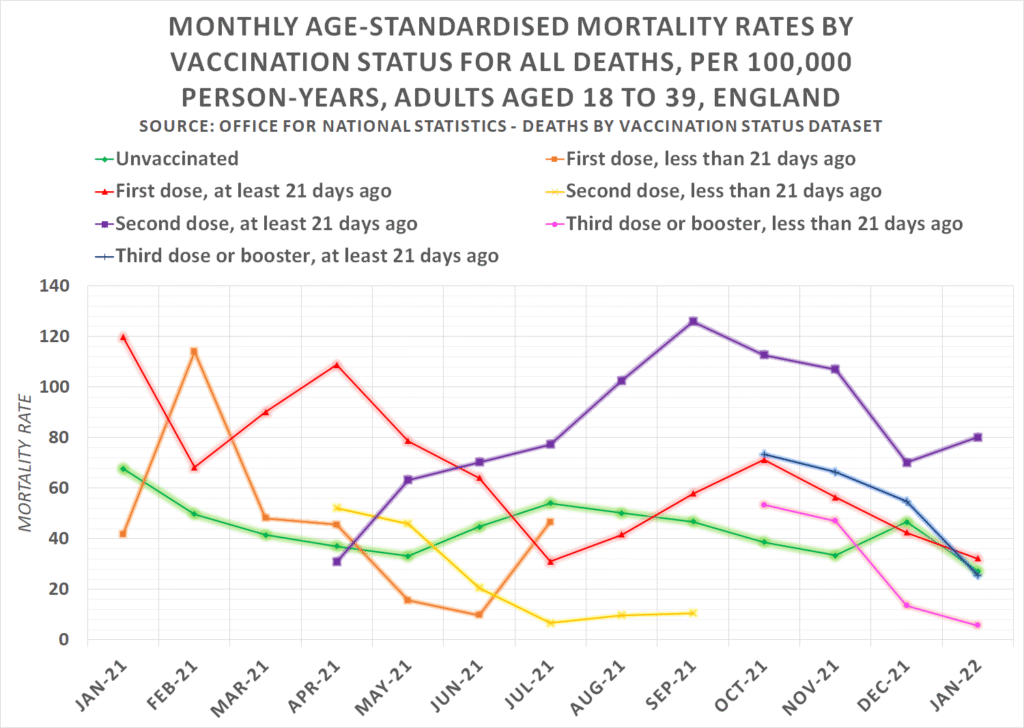
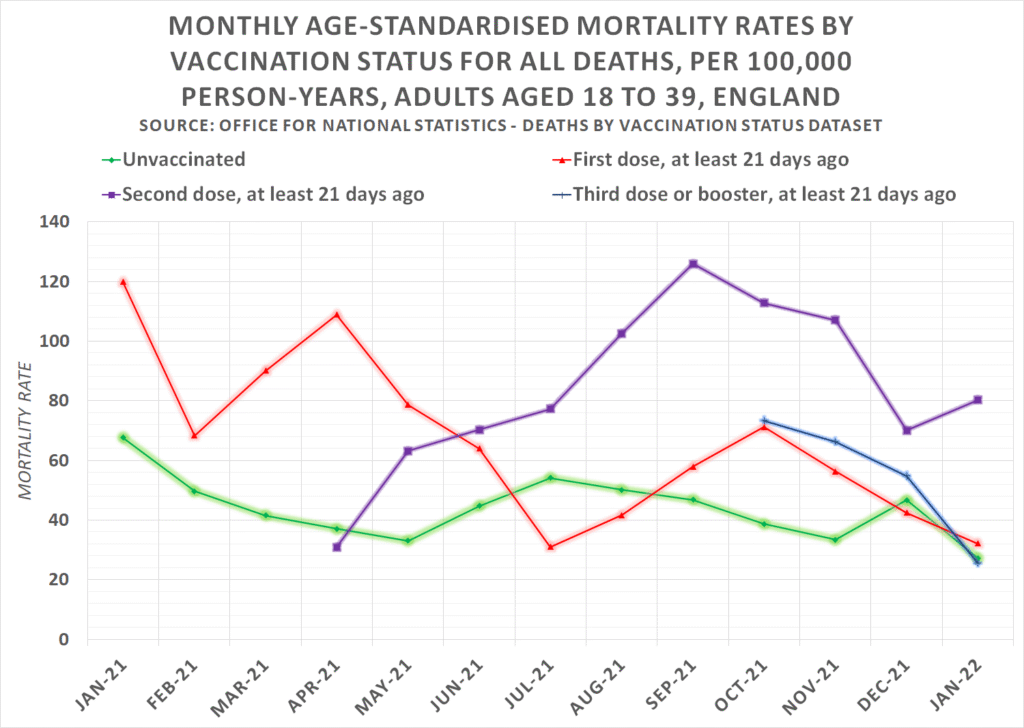
The above chart shows the monthly age-standardised mortality rates by vaccination status for all-cause deaths, per 100,000 person-years among adults aged 18 to 39 in England. The green line is the mortality rate among the unvaccinated, which while fluctuating has remained pretty stable throughout.
The other lines however represent different vaccination statuses, and they are extremely concerning. The orange, yellow, and pink lines represent mortality rates within 21 days of receiving a first, second or third dose. And they reveal that the risk of death increases significantly immediately after vaccination.
This may explain why figures found in ‘table 4’ of the same ONS dataset reveal 41,449 people died within 21 days of vaccination in England between 1st Jan 21 and 31st Jan 22 –
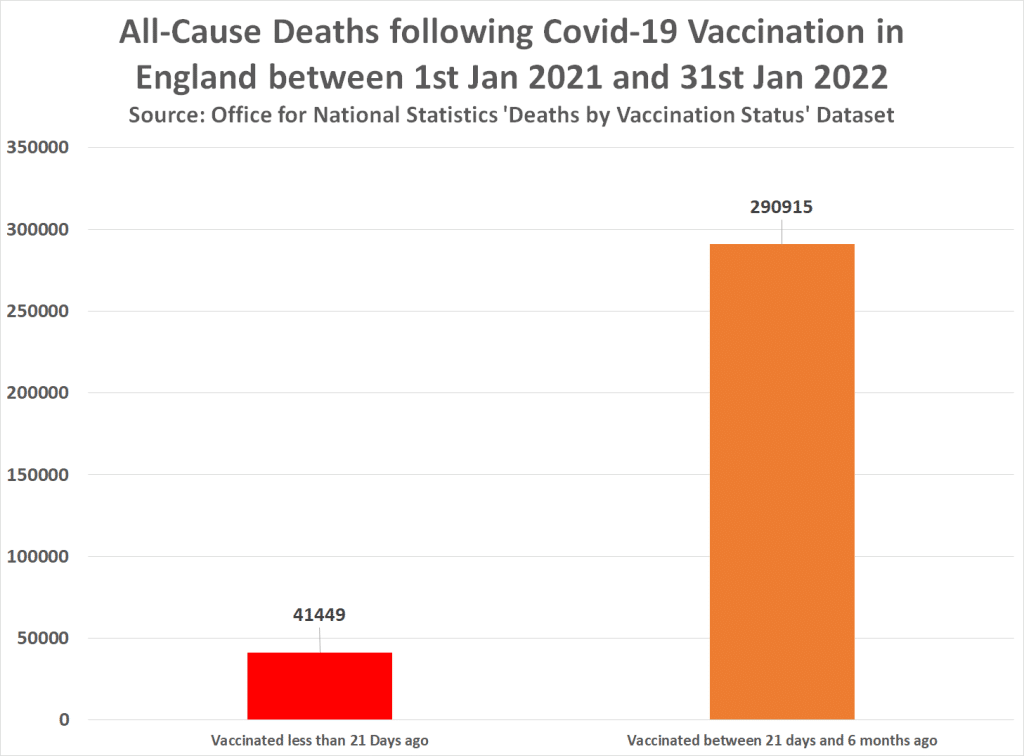
But the most concerning figures are the mortality rates among those vaccinated at least 21 days ago, which you can see more clearly in the following chart –
Around June 2021, there is a cross over from those who’ve received one dose to those who’ve received two doses in terms of the increased mortality rate against the unvaccinated. This obviously tallies with when each injection was administered to this age group. But what’s most concerning here is that the second injection seems to make things much worse in terms of the risk of death.
In January 2021 the mortality rate per 100,000 person-years among the unvaccinated equated to 67.7. This then fell month on month to 33.1 in May, before increasing again in June to 44.8. The same however cannot be said for those who had received a single dose at least 21 days prior to their death.
In January 2021 the mortality rate per 100,000 person-years among the partly vaccinated equated to 119.9. Meaning the mortality rate was 77% higher than the mortality rate among the unvaccinated. This then fell to 68.3 deaths per 100,000 in February, before climbing to 90.1 in March, then 108.8 in April.
This means at this point the mortality rate among the partly vaccinated was 193.3% higher than the mortality rate among the unvaccinated. But not long after following the second dose being administered things get even worse.
The highest mortality rate among the double vaccinated (at least 21 days ago) occurred in September 2021, with 125.9 deaths per 100,000 person-years. In the same month, the mortality rate among the unvaccinated equated to 46.8. Meaning the double vaccinated mortality rate was 169% higher than the unvaccinated mortality rate.
But the largest statistical difference occurred in November 2021. The mortality rate among the unvaccinated equated to 33.4 deaths per 100,000 person-years, whereas the mortality rate among the double vaccinated equated to 107. A difference of 220.4%.
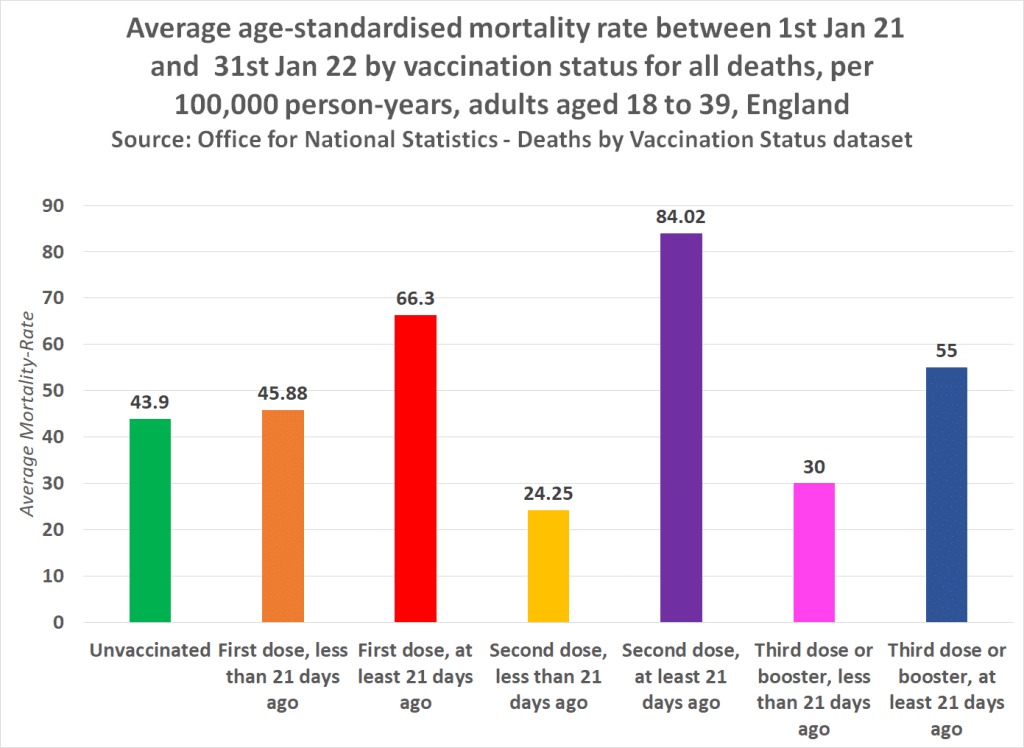
The following chart shows the average-age standardised mortality rate to have occurred between 1st Jan 21 and 31st Jan 22 by vaccination status for all-cause deaths, per 100,000 person-years among adults aged 18 to 39 in England –

The average mortality rate throughout these 13 months among the unvaccinated equates to 43.9 deaths per 100,000 person-years. But ignoring the mortality rate within the first 21 days of vaccination, we find that this is actually the lowest mortality rate among all vaccination statuses, and these include Covid-19 deaths in the rates.
The average partly vaccinated (At least 21 days ago) mortality rate equates to 66.3 deaths per 100,000. Whilst the average double vaccinated (At least 21 days ago) mortality rate equates to 84.02 deaths per 100,000 person-years between 1st Jan 21 and 31st Jan 22.
The average triple vaccinated mortality rate is also higher than the unvaccinated rate at 55 deaths per 100,000. But it’s worth noting here that there is only a couple of months’ data available on the third jab, so we need to wait for the next update to paint a clearer picture of what’s going on with that third dose, but the picture is already not looking very pretty.
So what these official figures from the UK’s Office for National Statistics strongly suggest is that Covid-19 vaccination kills and increases a person’s risk of death due to any cause, possibly by the havoc it reaps on both the cardiovascular and central nervous systems.
And it appears each additional dose makes things worse. On average the one-dose vaccinated were 51% more likely to die than the unvaccinated between 1st Jan 21 and 31st Jan 22.
On average the double vaccinated were 91.4% more likely to die than the unvaccinated between 1st Jan 21 and 31st Jan 22.
And based on the data available so far, on average the triple vaccinated are on average 25.3% more likely to die than the unvaccinated.
Therefore, it can no longer be denied that the Covid-19 vaccines are deadly because even the official Government published figures now prove it.
The Expose Urgently Needs Your Help…
Can you please help to keep the lights on with The Expose’s honest, reliable, powerful and truthful journalism?
Your Government & Big Tech organisations
try to silence & shut down The Expose.
So we need your help to ensure
we can continue to bring you the
facts the mainstream refuses to.
The government does not fund us
to publish lies and propaganda on their
behalf like the Mainstream Media.
Instead, we rely solely on your support. So
please support us in our efforts to bring
you honest, reliable, investigative journalism
today. It’s secure, quick and easy.
Please choose your preferred method below to show your support.
Categories: Breaking News, Did You Know?, The Expose Blog, World News
The whole pandemic like the climate change agenda is a scam and a con job to control you in everything you do and to get you to take the deadly to humans vaccine shots.
The EU has just recorded 53,000 excess deaths in July, that a massive 16% increase. U.S. and South America excess deaths are also increasing. Everywhere you are seeing babies, kids, teenagers and adults. Even the ones in great shape like those in sports or the military just up and dying.
Anyone still pushing the mask BS, lock downs, the vaccines shot or anything to do with the climate change agenda are guilty of lying to you. Who wants to remove your freedoms and rights only to control you and take more money out of your pocket in BS taxes and fees.
WWG1WGA
Don’t forget the Central Bank Digital Currency (CBDC) alongside Climate Hysteria, plandemics, untested vaxxines, stagflation, crop reduction, cattle destroyed, food factories burnt down in mysterious coincidences ..ad infinitum. Throughout history, we’ve seen periods of totalitarian elites try to extracate rights and powers from Joe Public, ordinary working class people, usually through dumbing down and media indoctrination – Did this recent attempt begin with the Lockstep program from the Rockefeller Foundation?
Who said humans are hackable animals?
Excellent job with the numbers as usual. I used to calculate mortality rates per 100K with the raw ONS data before I discovered Expose News. Saves me a lot of time and you present it in bar charts which I never did. The numbers tell the truth, the shocking undeniable truth. Even some guillible people started to twig there was something wrong last year when they started to spot adverts on the back of buses on how to tell the signs of stroke in children. I.e. the normalisation of the abnormal post jibbity jabs.
This one is a real 💎 lol. I had to see what other articles were off the mark, and this is the next Covid related “The Expose” article I read.
The authors first graph is supposed to be a visualization of the title claim that “ Vaccinated young adults are 92% more likely to die than unvaccinated young adults according to UK Government”.
There is a huge problem with this statement however, and it is evidenced in the screenshot of the data set he/she used to source the numbers for his graph. He used numbers from the wrong column.
image.jpg
The author used the figures in the column titled “mortality rate/ 100,000 person years” (I highlighted in blue) which he/she must have thought meant deaths/ 100,000 people, but it doesn’t. Person years is a special way researchers measure time in a study, and that it even occupies columns in this dataset means the author did not know how to use the dataset compilation tools, and checked off the wrong box somewhere.
The correct column to use data from for making the graph the author was trying to make would have been the “count of deaths” column (I highlighted in yellow”, as that is the count of deaths per 100,000 in population.
Adding up all of the deaths of vaccinated subjects in this column brings a total of 22 deaths/100,000 people, the deaths of unvaccinated subjects in the same column is 606 deaths/100,000 people, which means there were 27.5 times as many deaths of unvaccinated people as there were of vaccinated people that month,.
In fact the “92% more likely to die” that the author uses in the headline besides being based on numbers from the incorrect column in a dataset means absolutely nothing, as likelihood is calculated in multiples not percentages. If you were however to convert the percentage to a decimal 92% = .92, and if someone is .92 times more likely to die of something that means they are less likely, not more likely to die as 1 times as likely to die means both groups are equally likely to die.
What all of this shows more than anything is this author’s inability to understand even the most basic principles of statistics, and a trend from this website of authors that do not understand the subject matter they are writing about.
This is misleading. If the vaccine worked we wouldn’t be seeing statistics anything like this. The ONS stats are also completely untrustworthy and the reality is very likely much worse for the vaccinated than this analysis demonstrates (albeit with some errors).
People need to watch Queens College statistician, Prof Norman Fenton’s analysis which demonstrates why the statistcs don’t make any sense in the real world and probably for the following reasons.
The VACCINATED people killed by the vaccin,e most of whom die within 28 days or so (of whom there are a huge amount), are being classed as UNVACCINATED.
The unvaccinated population is being heavily underestimaged which is a trick that allows the ONS and others to skew the results to make the vaccine look more effective and the unvaxed more likely to die. Thus the per 100,000 rates are way off reality. Even a delay in recorded data can corrupt the results. As with everything else covid, the data is corrupt and misleading.
https://www.youtube.com/results?search_query=norman+fenton