





In the following article, David Turver demonstrates how the UK electricity grid expansion for Clean Power 2030 is in chaos. Costs are exploding and projects are massively delayed.
Let’s not lose touch…Your Government and Big Tech are actively trying to censor the information reported by The Exposé to serve their own needs. Subscribe to our emails now to make sure you receive the latest uncensored news in your inbox…
Grid Expansion Chaos: Soaring Costs And Significant Delays Demonstrate The Need For Independent Scrutiny
By David Turver, 12 July 2026
Introduction
When the National Energy System Operator (“NESO”) produced their plan to deliver Ed Miliband’s Clean Power 2030 (“CP2030”) goal, they said that all the planned transmission grid expansion works must be built on time and that “involves twice as much in the next five years as was built in total over the last decade.” From the outset, delivering on that part of CP2030 was always a tall order.
I have been contacted by several people over the past few weeks highlighting several issues that indicate these ambitious plans (some may say fantastical) will probably not be achieved. For those of us sceptical of Net Zero generally and Clean Power 2030 in particular, this represents both good news and bad news.
First, the good news: Slipping schedules means they will not spend all the money earmarked for grid expansion, which ought to mean our bills do not go up as much as feared. The bad news is that, based on the limited data available, it looks like the costs of this work are soaring out of control.
Let’s dig into the details, beginning with the bad news so that we can end on a high note.
NESO Forecast for Transmission Costs
As a reminder, the UK already has the highest industrial electricity prices in the developed world and amongst the highest domestic prices. Prices are set to go higher because the cost of transmission is set to increase markedly over the coming years.
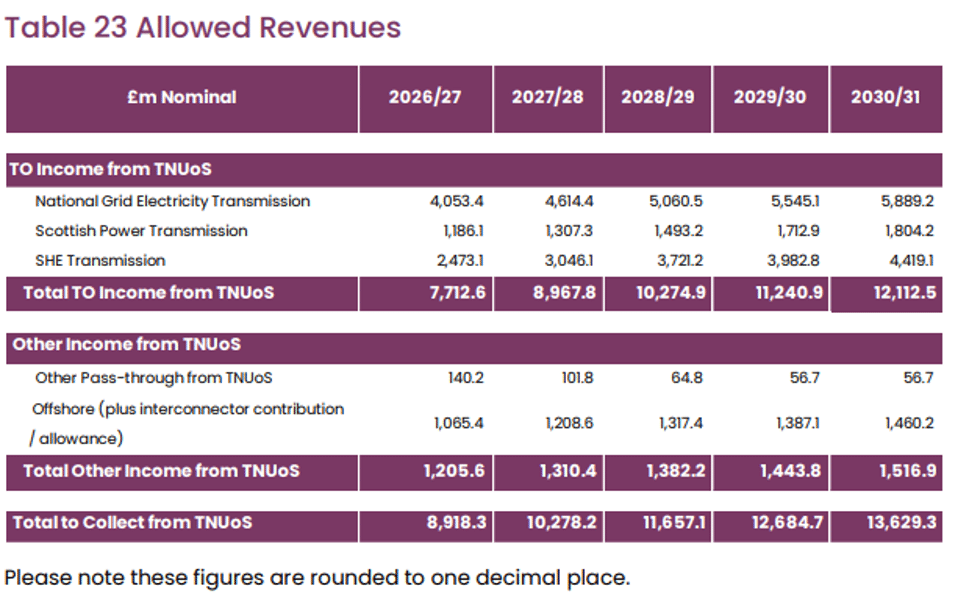
The cost of the transmission system, measured by the allowed revenue, was £2.8 billion per year as recently as 2020/21. Allowed revenues are forecast to more than triple to £8.9 billion for the current 2026/27 year and rise substantially again to £13.6 billion by 2030/31 (see Figure 1).
Soaring Project Costs
It appears that NESO’s forecast may be an underestimate, given some recent decisions by Ofgem regarding transmission project spending.
Back in late 2022, Ofgem published a list of projects that were required to hit the then Government’s 2030 target in its Accelerated Strategic Transmission Investment (“ASTI”) framework. The total cost of these projects, according to Table 6 of that document, was estimated to be about £23.3 billion. ASTI projects are only a subset of what is required to meet the current 2030 targets.
In December 2025, Ofgem warned that over £70 billion of transmission network upgrades (euphemism for grid expansion to connect remote renewables) would be required over the next five years.
In recent months, Ofgem has made decisions to support Early Construction Funding (“ECF”) for a series of projects run by Scottish & Southern Electricity, trading as Scottish Hydro Electric Transmission (“SHET”), Scottish Power Transmission (“SPT”) (HERE and HERE) and National Grid (“NGET”). Ofgem’s cost reporting is somewhat opaque. However, they do report the proportion of total project costs the agreed ECF makes up of the original cost estimate and the new proportion based on updated cost estimates. From these two numbers, it is possible to work out the percentage increase in costs of the underlying projects as shown in Figure 2, and it does not make for pretty reading.
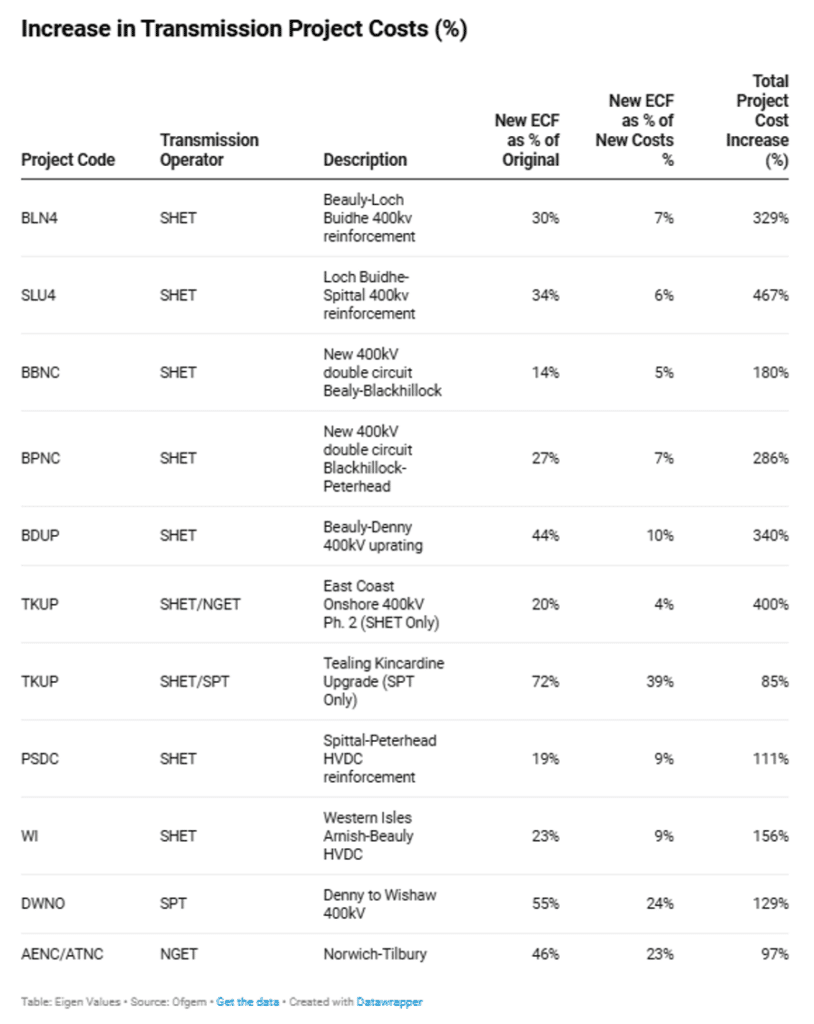
Taking the first line as an example. If the original project cost was say £10 million, and the new ECF is 30% of that original project estimate, or £3 million, and the new ECF now represents 7% of the revised total project cost, then the new project cost is £42.9 million (£10 million x 0.3/0.07) or an increase of 329% on the original cost.
As can be seen, the increase in the total cost of the projects ranges from 85% to 400%, with a simple average increase of 234%. This indicates that the cost of these ASTI projects is exploding. If this average increase was applied to the original estimate of £23.3 billion, the outturn will rise to almost £78 billion, further impacting electricity bills.
The ECF is supposed to fund things like land purchase and making early purchase commitments for long lead-time items like transformers. Originally, Ofgem was supposed to limit this early funding to 20% of the original cost. Now the cost of this early funding has exploded to 72% of the original total project cost for the SPT part of TKUP, and for almost all projects, ECF is already well above 20% of the original cost.
It certainly looks like NESO’s forecasts for transmission costs may well be an under-estimate. It also appears as though Ofgem is prioritising its duty to support Net Zero over the interests of consumers.
Project Delays
Not only are costs exploding, but progress looks painfully slow. NESO produces two databases that allow the progress towards upgrading the grid to be tracked. The first is the Transmission Entry Capacity (“TEC”) Register that contains a list of all the projects waiting for a connection to the grid. The second, the Transmission Works Report (“TWR”) lists all the transmission reinforcement schemes being carried out to facilitate the connection of the TEC projects. Both databases contain a common project ID that facilitates analysis of the TWR entries supporting each TEC project.
First, let’s look at a simple analysis of the TEC Register as shown in Figure 3.
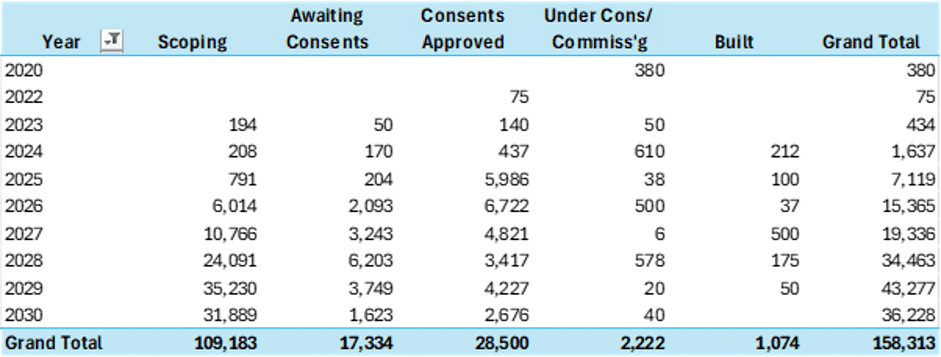
This totals the expected increase in MW for each TEC project split by the year the projects are expected to be delivered out to 2030. The total for each year is split into columns representing the stage of development of each project.
First, note that only 1,074MW has been built out of the total 158,313MW of projects in the queue. It may be that this is an underestimate because some completed projects may have been deleted from the list. Only 2,222MW is under construction or commissioning.
Now note that 109,183MW of the total projects expected to be delivered by 2030 are still in the scoping phase. Over 42,000MW of that total is expected to be delivered by the end of 2028, less than 30 months from now. It is unlikely these projects are going to happen.
Similarly, nearly 12,000MW of the total 17,334MW awaiting planning consent are expected to be delivered by 2028. Again, unlikely to be built on time. Even the 21,597MW with consents approved, expected to be built by 2028 must be at significant risk if the total construction capacity is only 2,222MW.
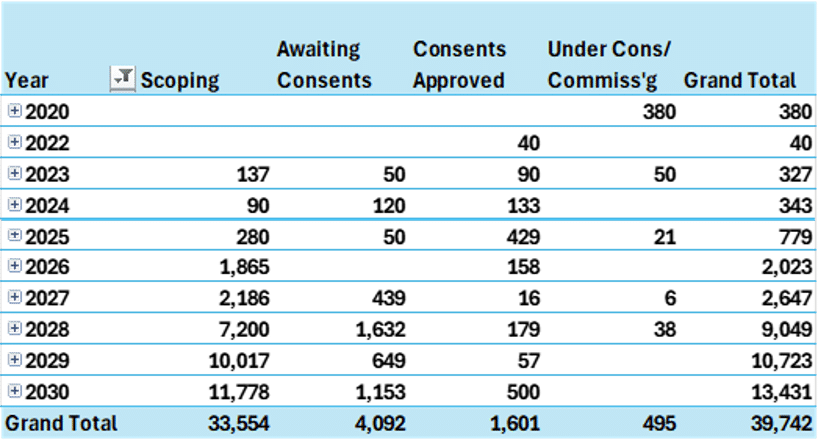
Figure 4 shows the TEC projects that do not yet have an entry in the TWR register. For the early scoping phase projects, this probably means the work required to deliver the projects has not yet been identified. It is possible that for some projects at later stages of development, the work has already been completed or no work is needed.
It is a challenging task to map the ASTI projects above onto the TWR register. With the assistance of Grok, it has been possible to map 11 of the original 27 ASTO projects onto the TWR. These mappings are not certain and should be treated with some caution. However, with that caveat, it can be deduced from the ASTI optimal delivery date in the original announcement and the expected effective date in the TWR that 9 of those 11 are running behind schedule, as shown in Figure 5.
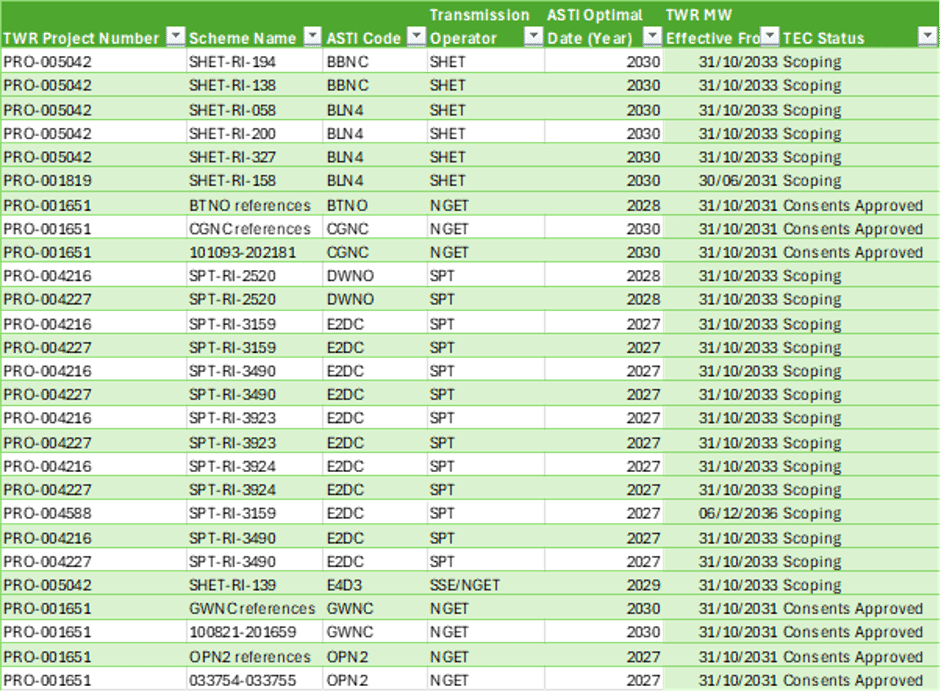
According to the corresponding entries in TEC for the TWR projects, five of the projects are still only in the scoping phase: BBNC (due 2030), BLN4 (2030), DWNO (2028), E2DC (2027) and E4D3 (2029). The others have consent approved but do not appear to have moved into the construction phase. It is unlikely these projects will be delivered by ASTI’s optimal delivery date.
In addition, National Grid only received ECF approval for several projects, PTNO (due 2029), PTC1 (2028) and EDN2 (2030) in February this year. It has not been possible to map these ASTI projects onto TWR, so it seems unlikely these projects will happen on time either.
The good news is that this painfully slow progress means that money will not be spent as fast, protecting us from future increases in electricity prices. Moreover, the problem faced by an incoming government seeking to cancel Net Zero will be correspondingly smaller.
Conclusions
NESO’s forecasts of future transmission costs are already extremely high and set to increase our electricity bills even more from an already high base. Ofgem’s recent approval of increases in ECF funding, despite massive increases in expected project costs, indicates that NESO forecasts may well be an underestimate. This does not bode well for future electricity prices.
Analysis of the TEC and TWR databases shows that progress towards expanding the grid is painfully slow, which probably means the money will not be spent as fast, protecting future bills. This probably means the wind, solar and storage system in the TEC database will not get connected either, further protecting consumers from paying subsidies, grid balancing and backup costs. The scale of the problem faced by an incoming, anti-Net Zero government will also be smaller.
It is also clear that it is difficult to track the status of these projects because of the disparate data, spread across both NESO and Ofgem. This needs to be remedied to improve transparency.
Taken together, this analysis shows that the overall grid expansion programme is in chaos. There is no chance it will be delivered on time and to budget. It is high time this programme is subject to external scrutiny by the Public Accounts Committee and National Audit Office. On any rational analysis, it cannot represent value for money for consumers.
About the Author
David Turver is a British retired consultant, chief information officer and project management professional. He publishes articles on a Substack page titled ‘Eigen Values’ where he writes about contentious issues such as climate, energy and net zero. You can subscribe to and follow his Substack page, ‘Eigen Values’, HERE.
Featured image: Aerial shot of large turbines at Ovenden Moor Wind Farm near the town of Halifax in West Yorkshire. Source: Getty Images
The Expose Urgently Needs Your Help…
Can you please help to keep the lights on with The Expose’s honest, reliable, powerful and truthful journalism?
Your Government & Big Tech organisations
try to silence & shut down The Expose.
So we need your help to ensure
we can continue to bring you the
facts the mainstream refuses to.
The government does not fund us
to publish lies and propaganda on their
behalf like the Mainstream Media.
Instead, we rely solely on your support. So
please support us in our efforts to bring
you honest, reliable, investigative journalism
today. It’s secure, quick and easy.
Please choose your preferred method below to show your support.

Categories: Breaking News, Latest News, UK News
Ironically, our new UNELECTED Prime Minister, Andy Burnham has just made the insane eco-zealot Ed Miliband Foreign Secretary. Imagine the hypocrisy now as Miliband flies all over the world, having wasted billions of the UK Taxpayers’ money on “eco” rubbish and vanity projects and banning people from buying tumble driers whilst he jets around the world in his dry cleaned suits.
Net Zero is like the Holy Water of the Catholic Church, just because you say it does not mean that it is true and real, this is a hoax and scam for $$$ and an insult to all people just like holy water.