
The UK Health Security Agency has published its latest Covid-19 Vaccine Surveillance report and yet again it has revealed that the majority of Covid-19 cases, hospitalisations, and deaths were among the fully vaccinated population over the past month.
But a more detailed look at three months worth of Covid-19 data published by the agency has revealed that current projections show the fully vaccinated are in for a very rough winter, infections rates are much higher among the fully vaccinated, and the hospitalisation-fatality rate among the vaccinated is 124% higher than the fatality rate among the unvaccinated population.

The latest Vaccine Surveillance report from the UK Health Security Agency was published Thursday November 18th and covers data on infections, hospitalisations and deaths from Week 42 to Week 45 of 2021 (October 18th – November 14th).
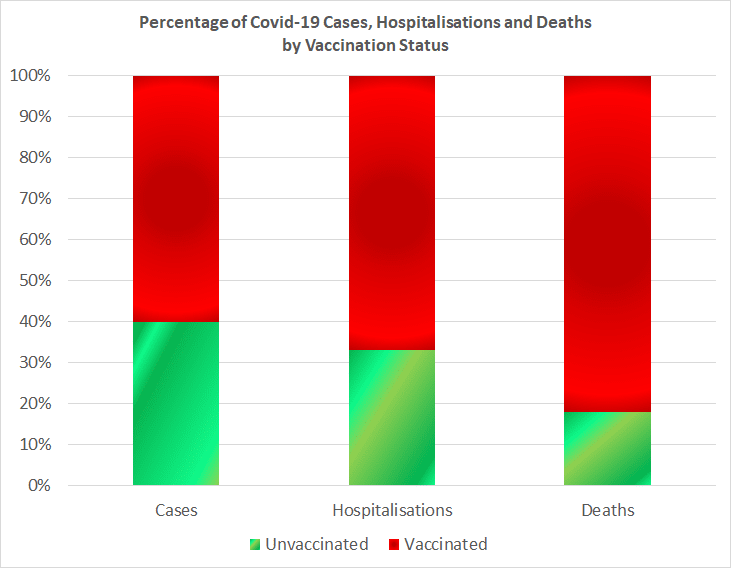
The report reveals that there were 850,438 recorded Covid-19 cases, 9,760 Covid-19 hospitalisations and 3,650 Covid-19 deaths from October 18th to November 14th. Of these the unvaccinated accounted for 40% of all cases, 33% of all hospitalisations, and 18% of all deaths. Whilst the vaccinated accounted for 60% of all cases, 67% of all hospitalisations, and 82% of all deaths.
The mainstream media cannot make their mind up on whether cases are going up or going down as we head into winter, and they have begun their assault on the unvaccinated with propaganda now being published to sway the nation into supporting a lockdown of the unvaccinated.
So we have analysed three months worth of data published by the UK Health Security Agency (UKHSA) to get a full picture on the alleged pandemic in England.
We used the following reports for our analysis –
- COVID-19 vaccine surveillance report – Week 38 (Covers Week 34-37)
- COVID-19 vaccine surveillance report – Week 42 (Covers Week 38-41)
- COVID-19 vaccine surveillance report – Week 46 (Covers Week 42-45)
Covid-19 Cases
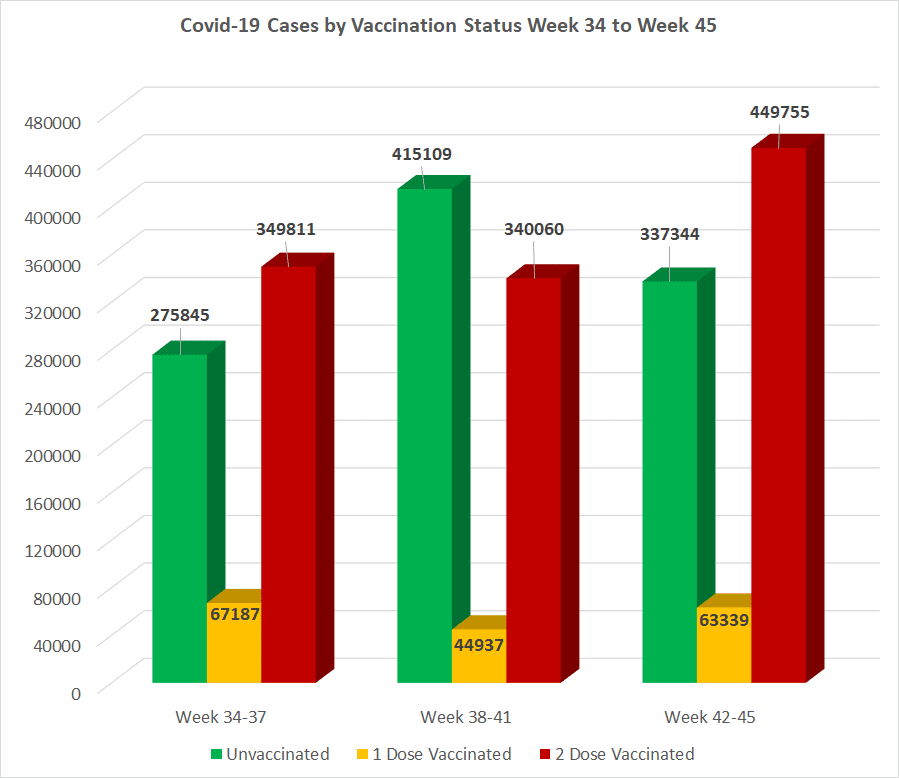
The above chart shows the total number of cases over the past three months by vaccination status. From August 23rd to November 14th, England has recorded a total of 2,343,387 cases. Of these 1,028,298 were among the unvaccinated population, 175,463 were among the partly vaccinated population, and 1,139,626 were among the fully vaccinated population.
Therefore, the vast majority of cases since at least August 2021, have been among the fully vaccinated population, proving that at least in terms of cases this is far from a pandemic of the unvaccinated. What’s also interesting to note here is how the cases have decreased among the unvaccinated over the past two months compared to how they have increased among the fully vaccinated as we head into winter.
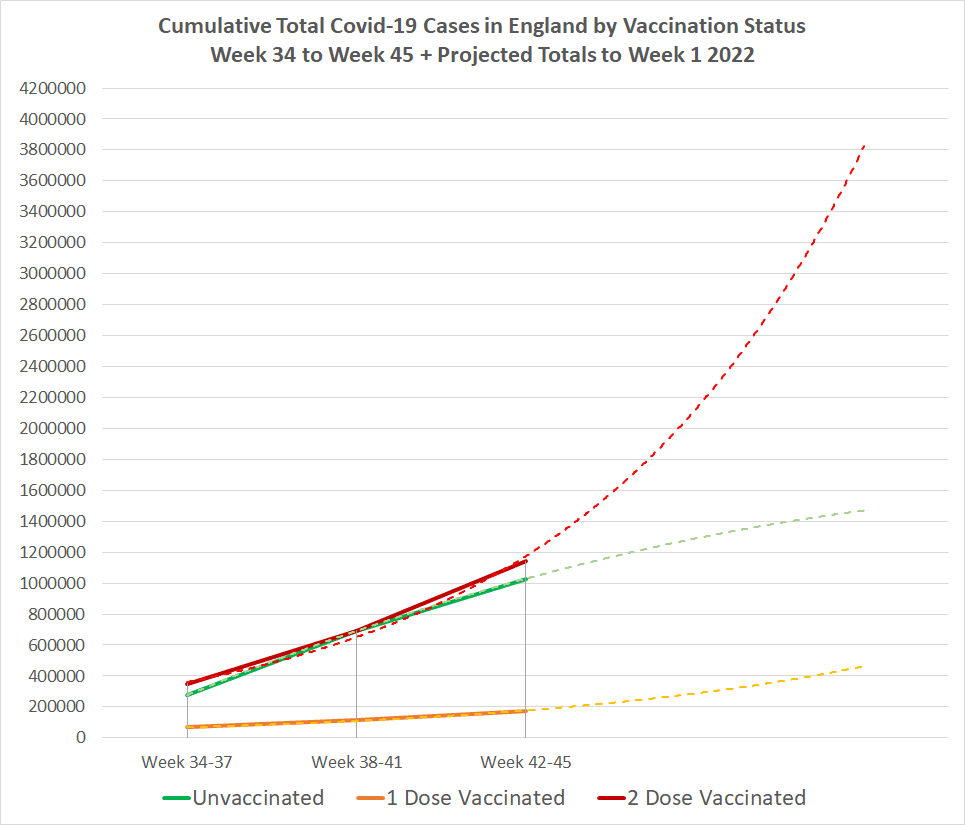
The above chart shows the cumulative number of cases over the past three months by vaccination status as well as the projected number of cases up to the first week of 2022, and things do not look good for the fully vaccinated.
Cases are projected to rapidly rise to an accumulative total of approximately 3,850,000 among the fully vaccinated, an increase of 2,710,374. Whilst the projected number of cases among the unvaccinated is expected to rise to just 1,450,000, an increase of just 421,702.
An increase is also projected among the partly vaccinated and this is due to the fact that children are now being offered a single dose of the Pfizer mRNA injection.
What this chart shows is that there can be no doubt we are only going to see a pandemic of the fully vaccinated this winter.
Covid-19 Hospitalisations
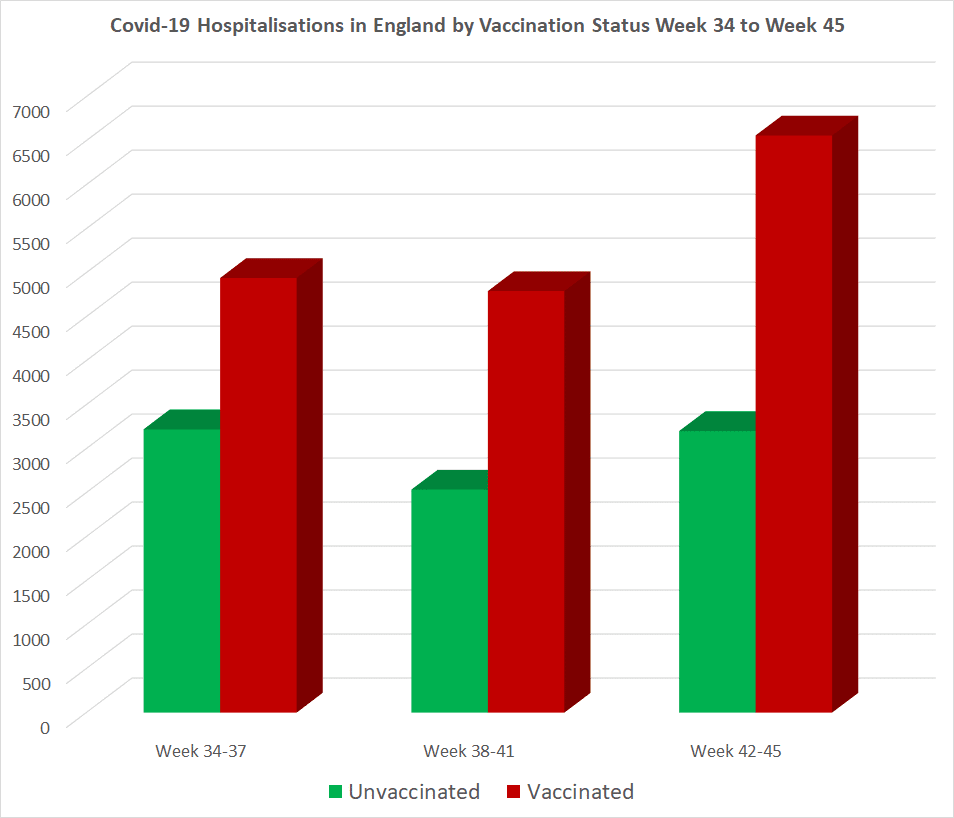
The above chart shows the total number of hospitalisations over the past three months by vaccination status. From August 23rd to November 14th, England has recorded a total of 25,245 hospitalisations. Of these 8,954 were among the unvaccinated population, whilst 16,291 were among the vaccinated population.
This shows that the vaccination are currently the biggest burden on the NHS, not the unvaccinated, and it also shows us something peculiar in terms of the overall picture considering the vaccines are supposed to reduce the risk of hospitalisation.
In all there were 1,028,298 cases among the unvaccinated between August 23rd and November 14th. Therefore, with a total of 8,954 hospitalisations, the case-hospitalisation rate among the unvaccinated is 0.89%.
However, with 1,315,089 cases among the vaccination population between August 23rd and November 14th, and 16,291 hospitalisations, the case-hospitalisation rate among the vaccinated is 1.23%.
Therefore, the case-hospitalisation rate among the fully vaccinated is 38% higher than the case-hospitalisation rate among the unvaccinated. Should this be the case when the Covid-19 injections are alleged to reduce the risk of hospitalisation by up to 95%?
But things are actually much worse for the vaccinated when we break things down into each month, because the case-hospitalisation rate has actually declined over three months among the unvaccinated whilst it has increased over three months for the vaccinated. Shouldn’t this be the other way round?
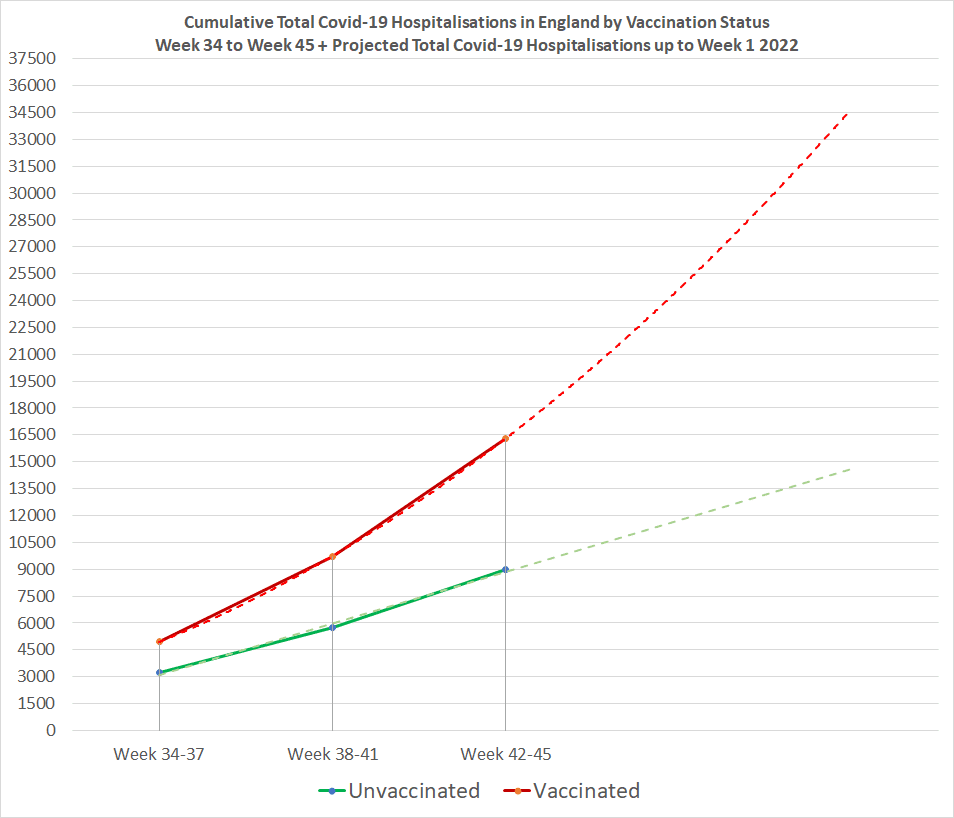
The above chart shows the cumulative number of hospitalisations over the past three months by vaccination status as well as the projected number of hospitalisations up to the first week of 2022, and yet again things aren’t looked great for the fully vaccinated.
Hospitalisations are projected to rapidly rise to an accumulative total of approximately 34,500 among the vaccinated, an increase of 18,209. Whilst the projected number of hospitalisations among the unvaccinated is expected to rise to just 14,500 , an increase of 5,546.
The vaccinated have currently accounted for 67% of hospitalisations since August 23rd, but from November 14th to the first week of 2022 they are projected to account for 77% of hospitalisations, meaning they may have accounted for 70% of hospitalisations since August 23rd by the time we enter the new year.
Covid-19 Deaths
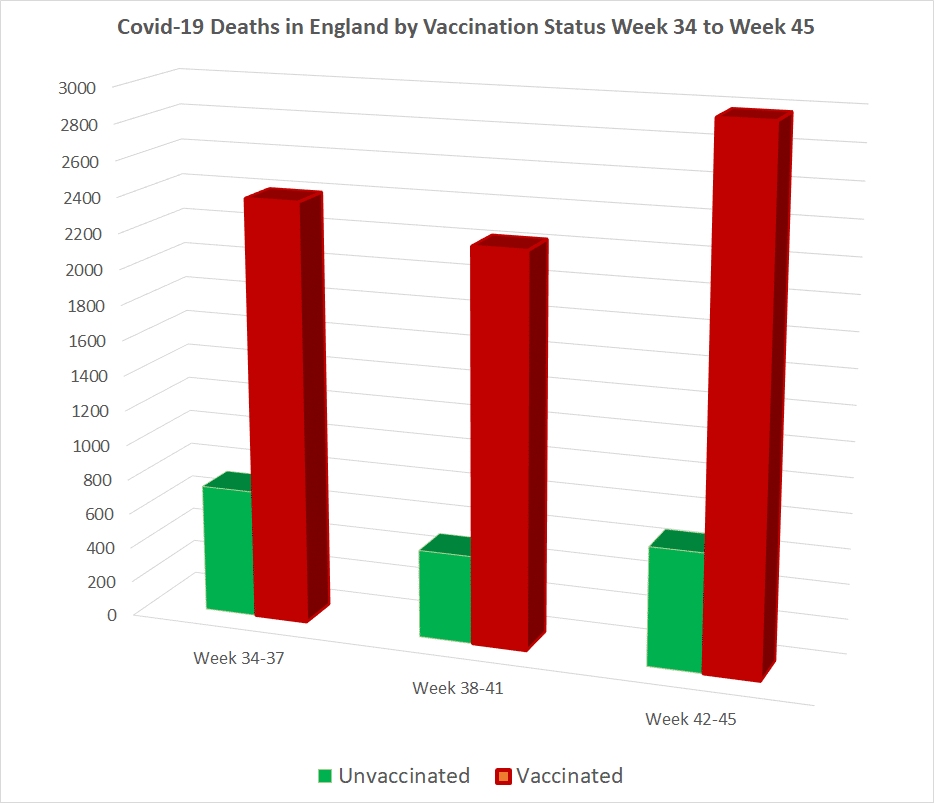
The above chart shows the total number of deaths over the past three months by vaccination status. From August 23rd to November 14th, England has recorded a total of 9,501 deaths. Of these just 1,907 were among the unvaccinated population, whilst a shocking 7,594 were among the vaccinated population, with nearly 3,000 of these deaths occurring in just the last four weeks.
Does this make sense to you when the vaccinated account for only 60% of cases and the vaccines are alleged to reduce the risk of death by 95%?
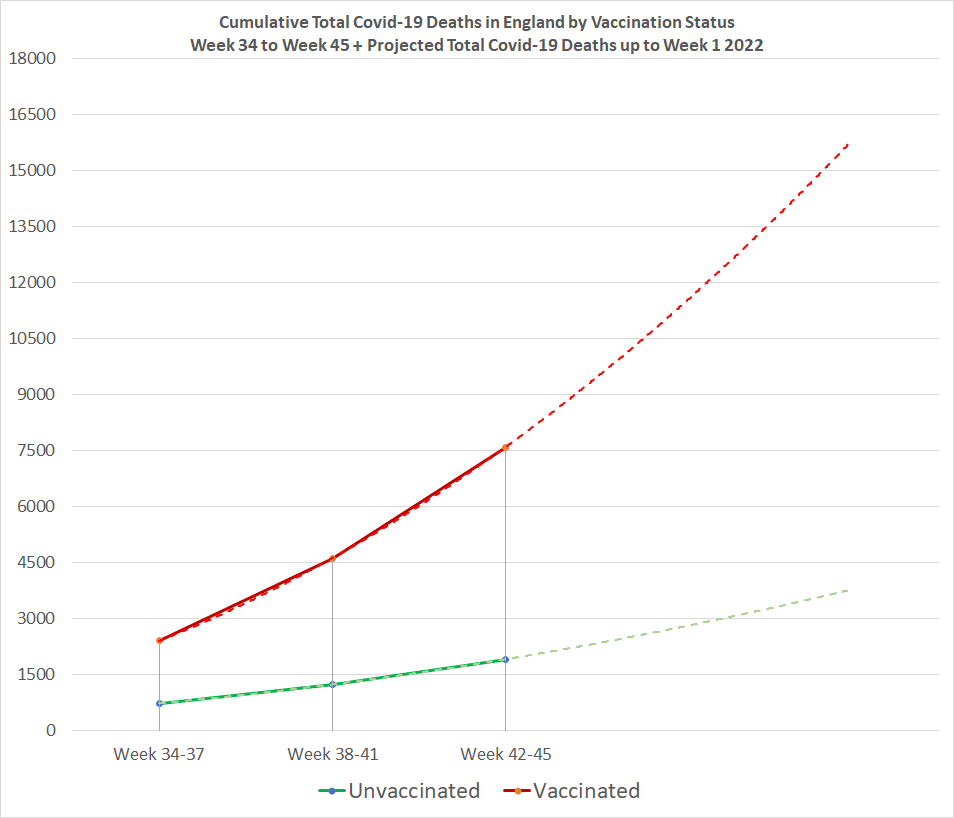
The above chart shows the cumulative number of deaths over the past three months by vaccination status as well as the projected number of deaths up to the first week of 2022, and things are looking quite disastrous for the fully vaccinated.
Deaths are projected to rapidly rise to an accumulative total of approximately 15,750 deaths among the vaccinated, an increase of 8,156. Whilst the projected number of deaths among the unvaccinated is expected to rise to just 3,750 , an increase of 1,843.
Covid-19 Hospitalisation-Fatality Rate
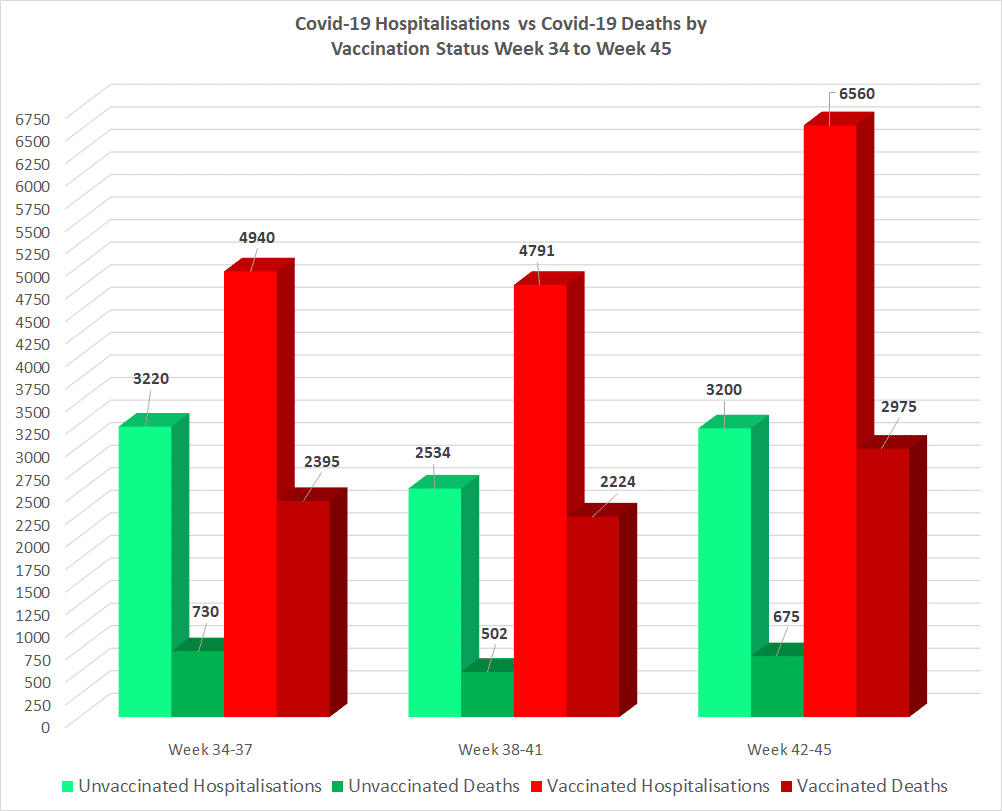
The above chart shows the total number of Covid-19 hospitalisations and deaths by vaccination status and allows us to compare the numbers side by side. What this clearly demonstrates is that there is a much higher hospitalisation-fatality rate among the vaccinated population that the rate among the unvaccinated population.
It also shows that in the month just gone things have got drastically worse for the vaccinated compared to the previous two months whilst things have actually improved for the unvaccinated population, whose worst month was month one of three between week 34 and week 37.
In all there were 8,954 hospitalisations and 1,907 deaths among the unvaccinated between August 23rd and November 14th. Therefore, the hospitalisation-fatality rate is 21%.
But with 16,291 hospitalisations and 7,594 deaths among the vaccinated population population the hospitalisation-fatiality rate is 47%.
This means the hospitalisation-fatality rate among the vaccinated population over the past three months has been 124% higher than the hospitalisation-fatality rate among the unvaccinated population, and unfortunately this is projected to get much worse for the vaccinated by the end of 2021.
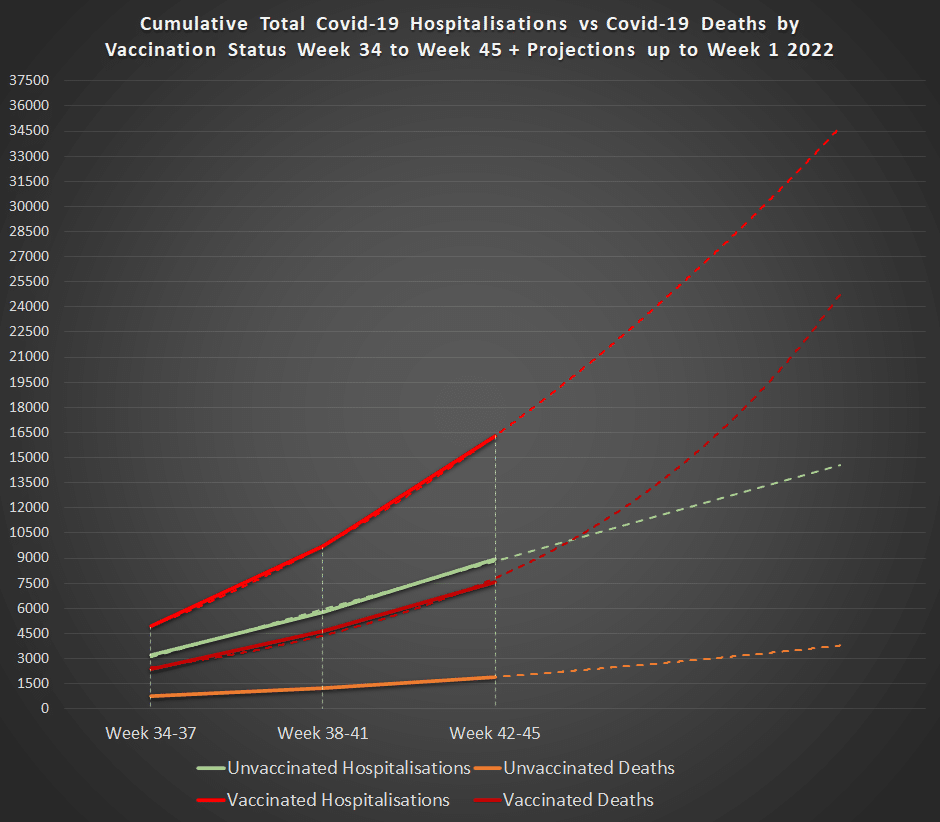
The above chart shows the cumulative totals of Covid-19 hospitalisations and deaths by vaccination status plus the projected cumulative totals through to week 1 of 2022.
What we can see here is that in just a few weeks time the cumulative number of deaths among the vaccinated is expected to surpass the cumulative number of hospitalisations among the unvaccinated population.
We can also see that the projected number of hospitalisations and deaths among the unvaccinated is projected to grow further apart over time, meaning the hospitalisation-fatality rate is expected to get much smaller. Whereas the opposite can be seen for the vaccinated as the projected number of hospitalisations and deaths is projected to grow closer over time, meaning the hospitalisation-fatality rate is actually expected to get even higher than the 47% rate seen over the past three months.
Why?
The reason the vaccinated are actually suffering far worse than the unvaccinated and are projected to suffer even more could have something to do with the fact that the data suggests the Covid-19 injections are decimating the immune systems of the vaccinated, as we demonstrated in a previous article published Tuesday November 16th which can be viewed here.
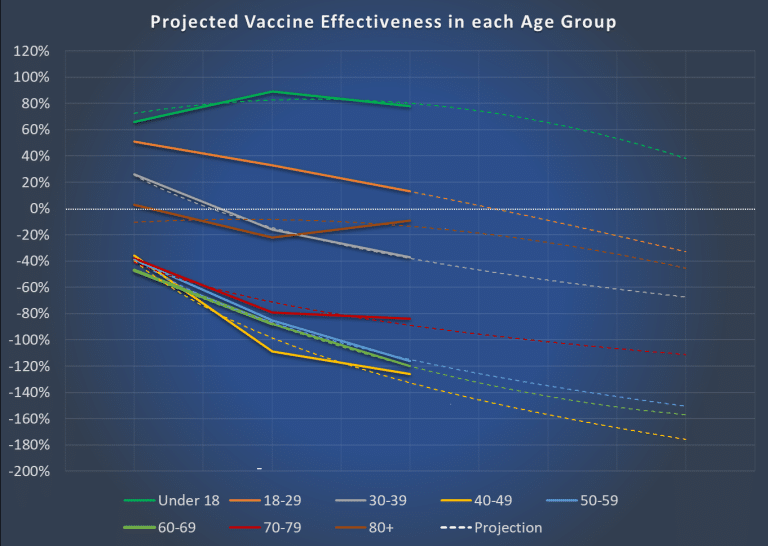
A vaccine effectiveness of +50% would mean that the fully vaccinated are 50% more protected against Covid-19 than the unvaccinated.
A vaccine effectiveness of 0% would mean that the fully vaccinated are 0% more protected against Covid-19 than the unvaccinated, meaning the vaccines are ineffective.
Whilst a vaccine effectiveness of -50% would mean that the unvaccinated are 50% more protected against Covid-19 than the fully vaccinated, meaning the vaccines actually decimate the immune system.
The following table shows the monthly decline in the immune systems of the vaccinated population against the unvaccinated –
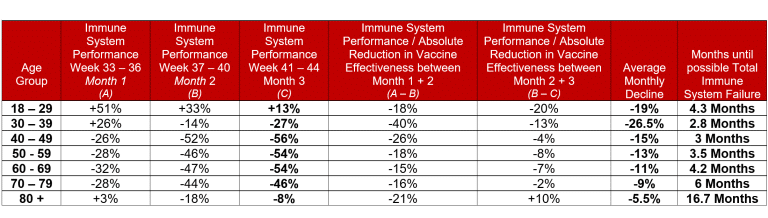
What this shows is that the fully vaccinated 30–39-year-olds have seen the largest drop in immune system performance over the past three months, with a 40% decline between week 33-36 and week 37-40, and a 13% decline between week 37-40 and week 41-44. This equates to an average monthly decline of -26.5% and means that in less than three months fully vaccinated 30-39-year-olds could be facing total immune system failure.
The fully vaccinated 40-49-year-olds are also not far behind having seen the second largest drop in immune system performance over the past three months, with a 26% decline between week 33-36 and week 37-40, and a 4% decline between week 37-40 and week 41-44. This equates to an average monthly decline of -15%. However, due to the fact that their immune system was already significantly compromised between week 33-36, they could be facing total immune system failure in just 3 months.
The anomaly in this data though is the immune system performance of the 70-79 and 80+ age group. As we know, prior to the vaccination campaign beginning the average age of a person to die following Covid-19 infection was over 85, even though the average-life expectancy in the UK is 81.
Therefore it’s odd to find that the largest immune system decline is among the younger age groups, but this is because the UK Health Security Agency data for week 41-44 is a time period in which the over 70’s were being giving their booster jab, so we’ve compiled the following table to demonstrate the immune system performance pre-booster jab and post-booster jab in fully vaccinated individuals over the age of 70.
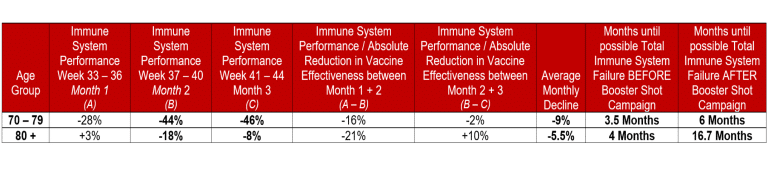
As you can see from the above the 80+ age group had just 4 months remaining until they possibly reached total immune system failure, but following the roll-out of the booster jab this has increased to 16.7 months.
However, since we know the vaccine effectiveness is proving to decline at a significant rate after a short period, and with evidence suggesting the vaccines are not only ineffective but also decimate the immune system, within the next month of two we could see that the booster shot has actually compromised the immune system of recipients even further, and an even quicker decline in immune system performance may materialise.
Conclusion
Cases are actually on the way up as we head into winter so it’s very unlikely, they’re about to decline considering we’re heading into the season of the year that respiratory viruses thrive.
This also isn’t a good sign for the vaccinated because they are suffering a much higher case-hospitalisation rate and hospitalisation-fatality rate to that of the unvaccinated population.
Projections also show that things are going to get much worse for the vaccinated whilst they improve for the unvaccinated.
The data proves without a shadow of a doubt that England is currently in the midst of a Pandemic of the Fully Vaccinated, not a Pandemic of the Unvaccinated, and projections show it may be about to get out of control.
So if authorities want to bring back restrictions or further lockdowns they need to keep the vaccinated in their homes, because it is the fully vaccinated who are the drivers behind the ongoing transmission of the virus, it is the fully vaccinated who are overwhelming the NHS, and it is the fully vaccinated who are losing their lives allegedly due to a virus that had just a 0.2% fatality rate prior to the vaccination roll-out.
The Expose Urgently Needs Your Help…
Can you please help to keep the lights on with The Expose’s honest, reliable, powerful and truthful journalism?
Your Government & Big Tech organisations
try to silence & shut down The Expose.
So we need your help to ensure
we can continue to bring you the
facts the mainstream refuses to.
The government does not fund us
to publish lies and propaganda on their
behalf like the Mainstream Media.
Instead, we rely solely on your support. So
please support us in our efforts to bring
you honest, reliable, investigative journalism
today. It’s secure, quick and easy.
Please choose your preferred method below to show your support.
Categories: Latest News
The vaccinated are “not vaccinated” until 14 days have passed from the last jab, so one must wonder how many of those waiting for the 14 days to pass, have died amongst the “not vaccinated” too.
The majority of those who have not had a vaccine at all, stand a much better chance of clearing Covid altogether, especially if they do my free salt water cure to kill Coronavirus before it gets to be Covid anything.
Thus those who have had their booster shots, but not reached “immunity” plus those with “breakout infections” due to Covid probably represent a much higher death rate, than your figures actually show.
what is salt water cure, never heard of this
From first jab, through second jab, plus, 2 weeks – could be ‘unvaccinated’ for at least 6 weeks, or more. All very convenient…
Excellent report! Well done on the analysis.
Your report clearly states that the UK is suffering from a pandemic of the vaccinated instead of the unvaccinated.
So where do get media and officials their data from to blaim the unvaccinated population to be the reason for ICU overflow and pandemic progress? This is what mainstream media keeps us telling all the time. Just yesterday german politicians have introduced a much more restrictive catalogue of actions to defend covid in the country. Restrictions are chosen to ‘defend’ the unvaxed as they are being held responsible for the situation Germany is facing at the moment.
You report shows data related to cases and hospitalizations. Do the official data also show information about the number of ICU cases as per sex, age and vaccination status?
Thanks a lot for your excellent work.
Best regards
Armin
The data may be manipulated or selective… ask yourself… does it make any sense? First of all mRNA and the J&J DNA work completely differently, yet note there is no mention in the data. Sorry but I work with data every day and this data looks odd.
Certain people would like to burn and bury this report.
I would love to know where you get the rates per 100,000 in table 3. These are not in the actual government report so I assume you calculated these yourself?
The columns showing rates in Table 3 were added directly from table 6 of the UKHSA report – to save space for this article, presumably. So, a better question is, “how does the UKHSA calculate rates/100K?” Because it sure as heck isn’t an accessible or transparent methodology!
Now,let’s have a guess at how many of the non vaxxed would have even had to set foot near a hospital thus causing work for the medical staff if that same medical staff hadn’t callously stolen all the medicine necessary to treat those who at last,got their foot in the door.Nobody wants this situation but to harm children as well is tantamount to declaring war.There is absolutely no reason for this pandemic except for the one sided raw deal dealt out by Pfizer by way of contract which all our intrepid politicians appear to read every morning.
Where do you have data in your first table with the coloured mark from? They are not from the original weekly surveillance report. In table 6 of the original report it says the unvaccinated suffer from around double the mortality rate of the vaccinated. So, can you,please, explain the origin of you added numbers? I really would like to agree to you, but I need to understand your way and origin of counting. Thanks.
It comes from table 6 of the original report. The problem is that the same table 6 also says hospitalization and mortality RATES per 100k are much higher for the unvaxxed. I do not understand how table 6 is calculated, I do not see its relationship with the previous tables with raw numbers. It would be quite crucial.
https://ukhsa.blog.gov.uk/2021/11/02/transparency-and-data-ukhsas-vaccines-report/
https://osr.statisticsauthority.gov.uk/communicating-data-is-more-than-just-presenting-the-numbers/
After reading the 2 links above the only thing I get is that we should not rely on those numbers to estimate vaccine efficacy.
Edit: page 16 says:
“The rate of COVID-19 cases, hospitalisation, and deaths in fully vaccinated and unvaccinated
groups was calculated using vaccine coverage data for each age group extracted at the midpoint of the reporting period from the National Immunisation Management Service.”
I must admit that I do not understand it, especially in connection with the previous tables
Something very wrong with this data. The more people that get vaccinated the higher the peerage of cases will be among the vaccinated. Presenting the data this way is very misleading and doesn’t help advance the real argument that we’d all like to make which is that these vaccines are not safe and effective. Essentially you are just propagating your own form of propaganda.
Sorry but does this data make any sense. How could as person with even a little immunity left over from a vax be twice as likely to die than someone with no immunity… does that make any kind of scientific sense?
Problem is vaccine only last 5 – 6 months. The continuing need for endless vaccinations maybe lowering the immunity and longer term there may be big problems for the vaccinated population – whereas those naturally immune have a far more robust immunity.
With Covid, the vaccines we have seen so far target a single part of the virus, the famous spike protein. That is in sharp contrast to what happens when we meet the virus naturally. In the latter case, the infection provokes production of antibodies against a range of virus proteins, including the spike but also one called the nucleocapsid or N-protein. This plays a key role in the virus’s life cycle. So, people who mount a successful immune response to the infection subsequently enjoy much better protection than the merely vaccinated.
The problem goes still deeper: when those who have had the jab are exposed to the natural infection, their antibodies focus on the spike protein with which they were originally inoculated. If that has changed in the meantime, it becomes much easier for the virus to bypass the immune defences – ‘potentially for good, and in billions of people
To assess how many people have developed natural infection, public health experts in England have been measuring Covid antibodies in blood donors. Immunity towards the N-protein has been rising very slowly, and is especially low – around 5-15 per cent – in the most heavily vaccinated age groups. In contrast, antibodies to the spike protein – elicited both by vaccines and infection – have reached 96 per cent.
The UKHSA clearly states that recent surveillance data show the N antibody levels ‘appear to be lower in individuals who acquire infection following two doses of vaccination’.
“In its Week 42 “COVID-19 vaccine surveillance report,” the U.K. Health Security Agency admitted on page 23 that “N antibody levels appear to be lower in people who acquire infection following two doses of vaccination.” It goes on to explain that this antibody drop is basically permanent.”
https://assets.publishing.service.gov.uk/government/uploads/system/uploads/attachment_data/file/1027511/Vaccine-surveillance-report-week-42.pdf
I have been told it is GOOD that the antibodies decline: the body should have developed T cells/B cells which lie quiet until coming into contact with the virus: then they kick in and fight.
But if antibody levels remain high the body is constantly in preparedness mode, and that is when the antibodies are constantly patrolling the body looking for the virus! That is actually not good and puts strain on the body, and there is more likelihood that the antibodies mistake something else for the virus and that is when there is risk of attacking things they shouldn’t.
Also: the figures are showing waning “immunity”/antibody levels: not a breakdown of the immune system: just ability to combat virus.
The vaccine may cause body to attack itself, and may cause other side effects not yet realized, especially with all the variants/mutations etc. So I believe that It would be better to focus on treatments, and strengthening immune system, rather than chasing vaccines for a virus that has potential to change.
Where does that immune system degradation data come from please?
I think you have made some miscalculations in the following paragraph “The report reveals that there were 850,438 recorded Covid-19 cases, 9,760 Covid-19 hospitalisations and 3,650 Covid-19 deaths from October 18th to November 14th. Of these the unvaccinated accounted for 40% of all cases, 33% of all hospitalisations, and 18% of all deaths. Whilst the vaccinated accounted for 60% of all cases, 67% of all hospitalisations, and 82% of all deaths.”
The 850,438 cases appears to be a sum of Total+Unlinked but if you add all the columns across from Unlinked onwards they equal the Total figures, ie unlinked is part of the total, not additional (see attached table).
The same apparent calculation error occurs for hospitalisations. I haven’t checked the death numbers but likely the same issue.
I, like some others commenting here, am not convinced by all the interpretations of this data.
The figures are showing waning “immunity”/antibody levels: not a breakdown, or complete anticipated breakdown, of the immune system: the figures just show the body’s waning ability to combat this Covid virus: but only if looking at antibodies.
I have been told it is GOOD that the antibodies decline: the body should have developed T cells/B cells which lie quiet until coming into contact with the virus: then they kick in and fight.
But if antibody levels remain high the body is constantly in preparedness mode, and that is when the antibodies are constantly patrolling the body looking for the virus! That is actually not good and puts strain on the body, and there is more likelihood that the antibodies mistake something else for the virus and that is when there is risk of attacking things they shouldn’t.
The vaccine may cause body to attack itself, and may cause other side effects not yet realized, especially with all the variants/mutations etc. We don’t know yet. The governments are now trying to understand “Covid toes” as that appears to be an overresponse to the vaccine. TOO LITTLE IS KNOWN.
So I believe that It would be better to focus on treatments, and strengthening our immune systems, rather than chasing vaccines for a virus that has a potential to change.
I am reluctantly double vaccinated AstraZeneca, and have had ongoing side effects since day 1, and am very wary of a booster.