New figures published by the UK’s Office for National Statistics reveal the Covid-19 vaccinated population are much more likely to die of any cause than the unvaccinated population in England among all age groups.
This is unequivocal proof that the Covid-19 injections have been and are still killing people, and patterns within the ONS data suggest it takes five months after vaccination for the deadly consequences to be fully realised.
Let’s not lose touch…Your Government and Big Tech are actively trying to censor the information reported by The Exposé to serve their own needs. Subscribe to our emails now to make sure you receive the latest uncensored news in your inbox…
On the 17th May, the Office for National Statistics (ONS) published its latest dataset on deaths by vaccination status in England, and it has revealed a whole host of shocking findings.
For example we now know that according to the ONS, 70,000 people have died within 28 days of Covid-19 vaccination in England, and 179,000 people have died within 60 days.
We also now know that Covid-19 vaccination increases children’s risk of death between 8,100% and 30,200%.
But it turns out that once you dig a little deeper into data, you find that Covid-19 vaccination actually increases the mortality rate of everyone within approximately 5 months.
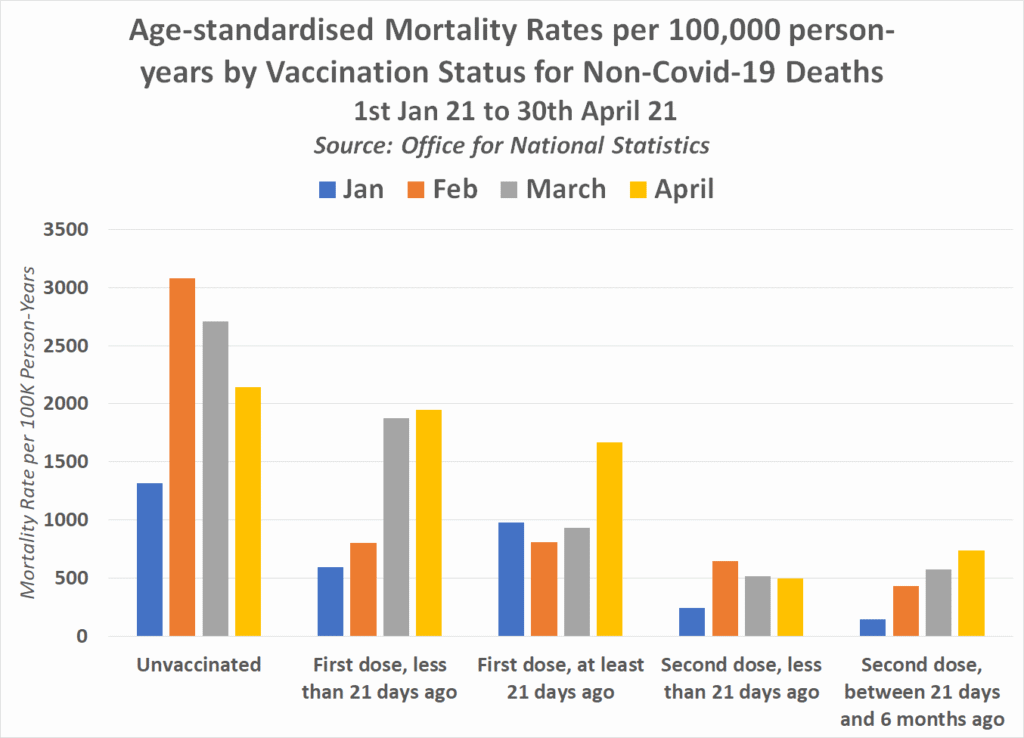
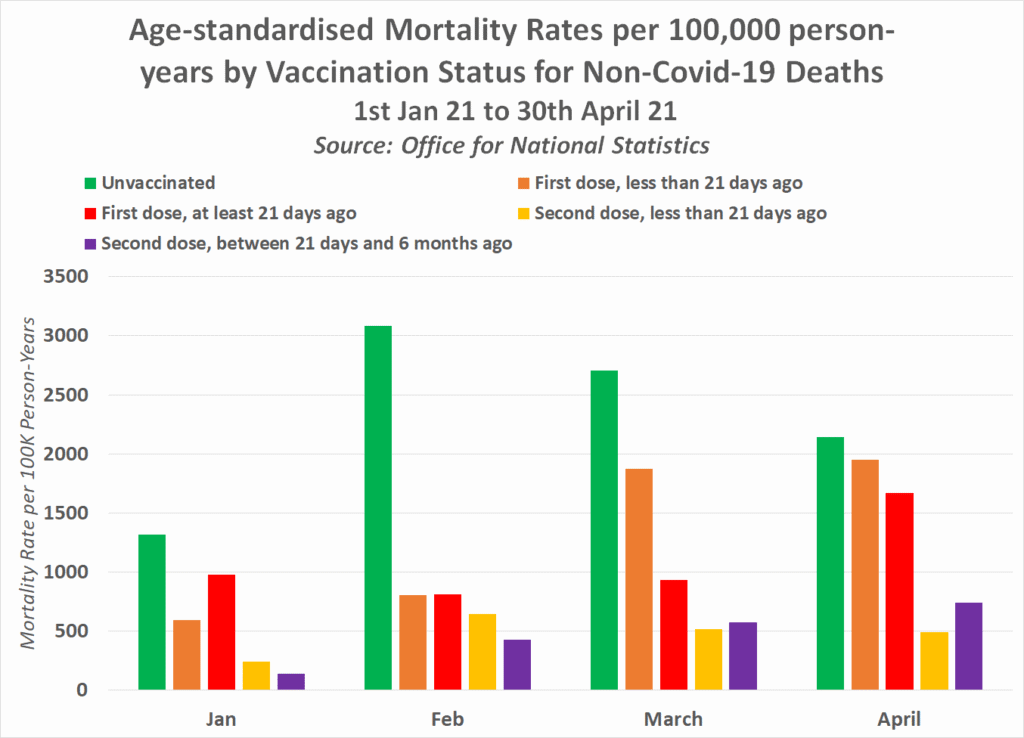
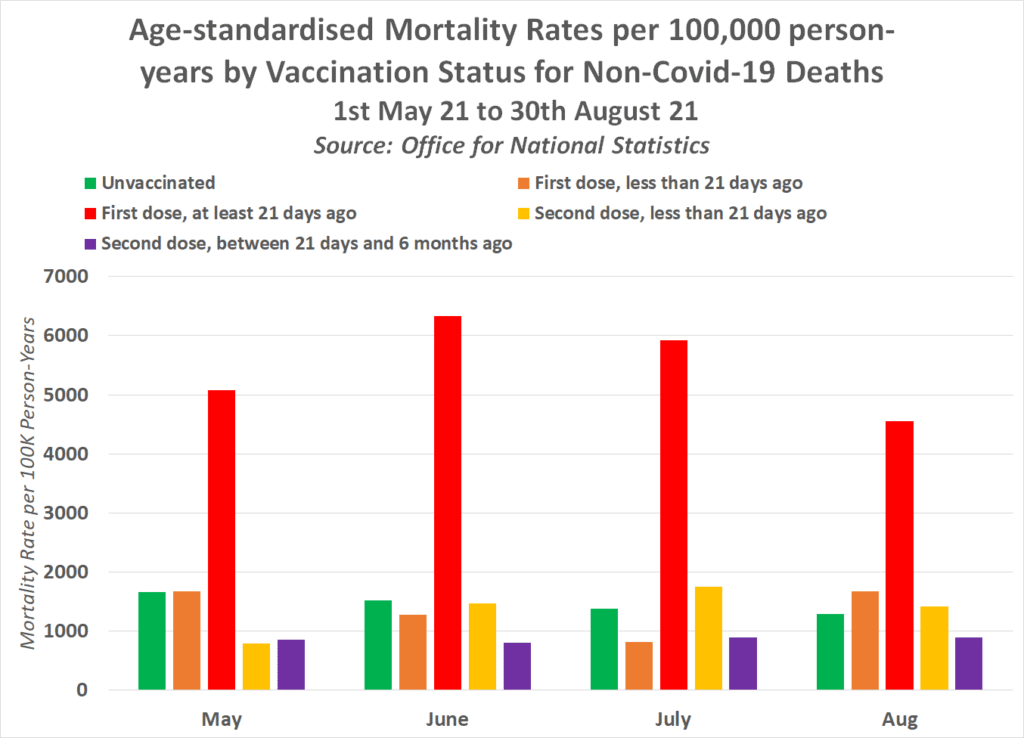
Table 1 of the ONS dataset contains figures on the monthly age-standardised mortality rates by vaccination status for deaths between 1st Jan 21 and 31st March 22. The first Covid-19 injection was administered in England on 8th December 2021, and here are the figures on mortality rates by vaccination status in the following 4 months –
The unvaccinated were substantially more likely to die of any cause other than Covid-19 than the vaccinated population in both January and February 2021, before the rates seemed to normalise by the end of April.
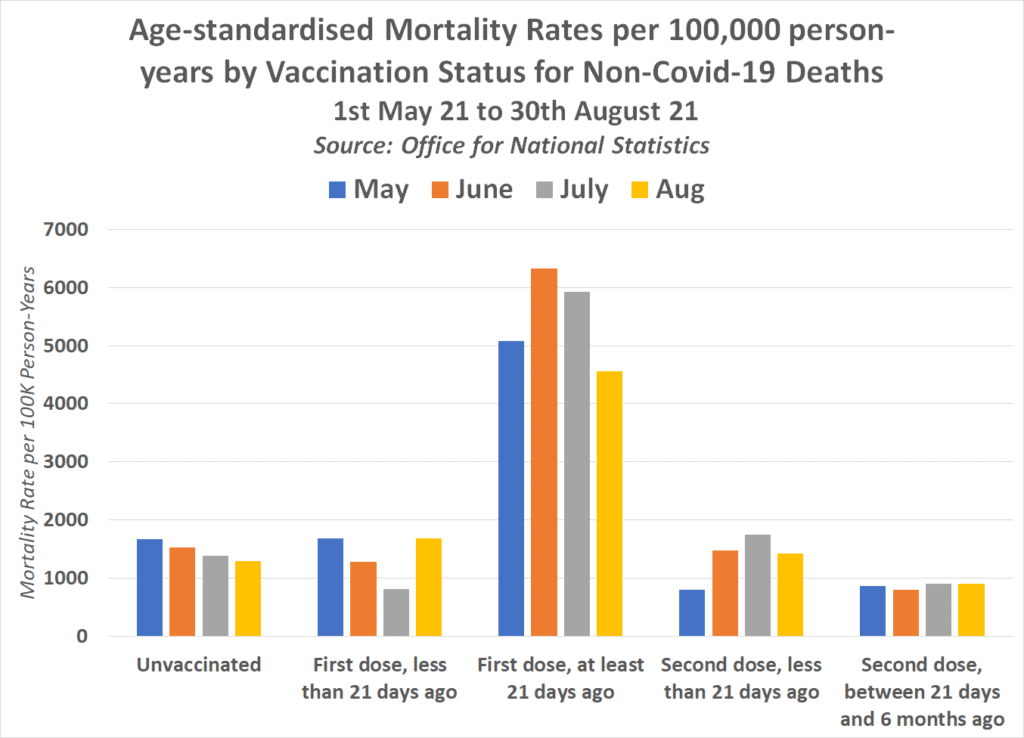
But look at what happened from May 2021 onwards –
All of a sudden, the vaccinated population as a whole were more likely to die than the unvaccinated of any cause other than Covid-19, and this trend has continued month after month since. It also turns out this trend tally’s up with those who received the Covid-19 injections first.
People in England were vaccinated by order of age, with the eldest being offered the Covid-19 injection first.
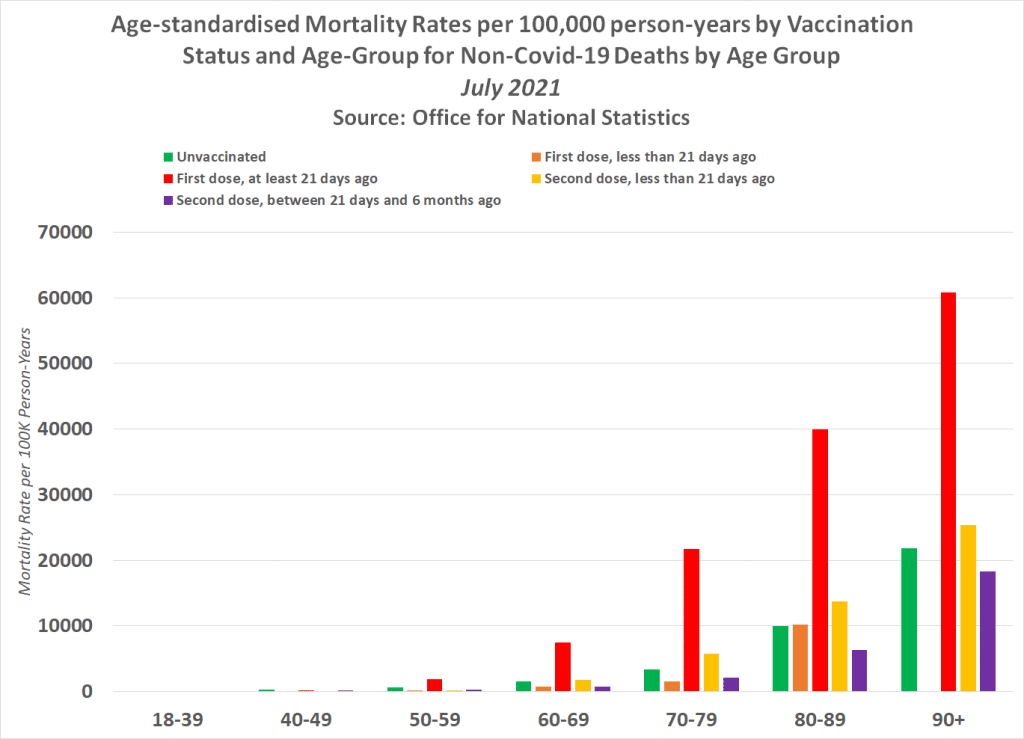
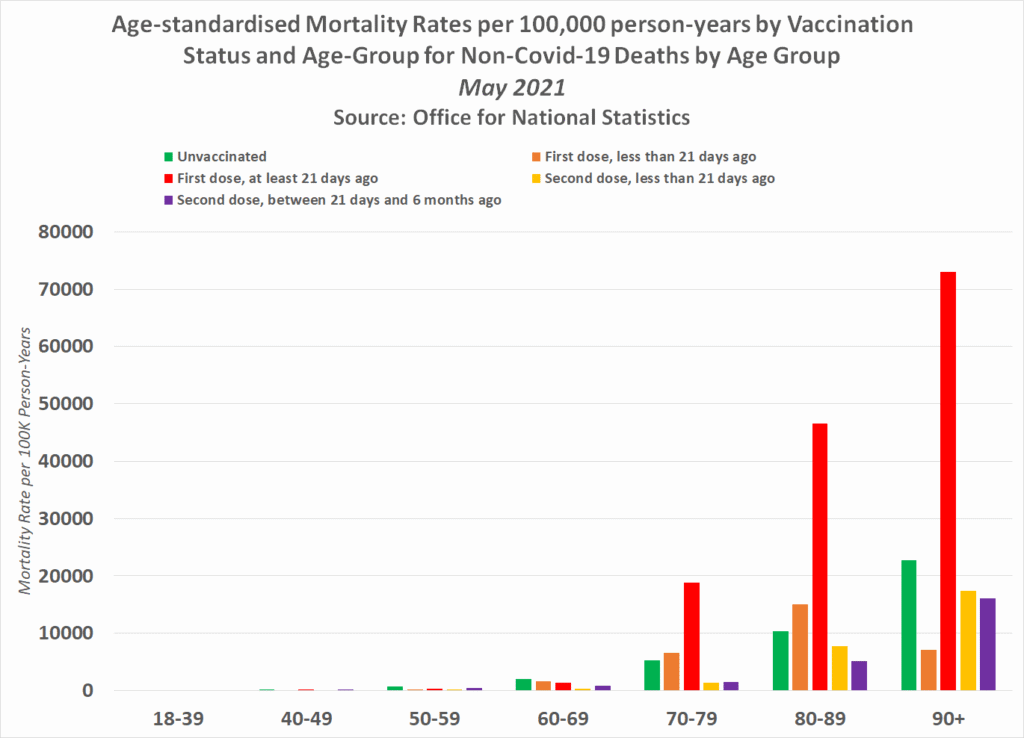
The following chart shows the age-standardised mortality rates per 100,000 person-years by vaccination status and age-group for the month of May 2021 –
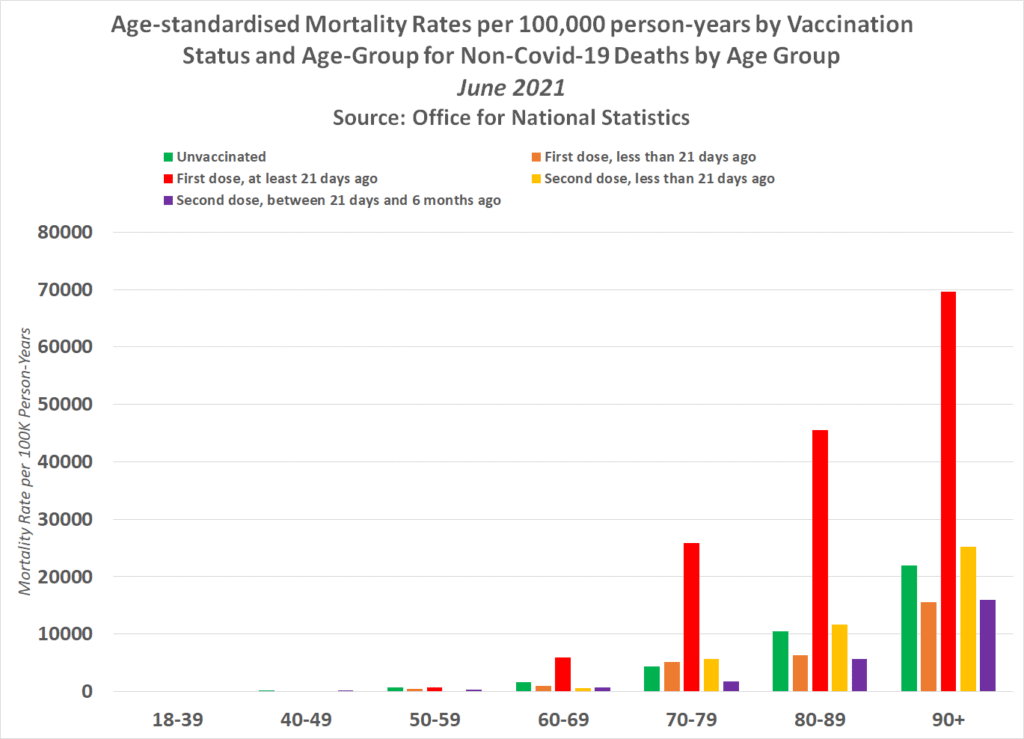
The figures show that in May the three age groups who had a higher mortality rate among the vaccinated were the 70-79, 80-89, and 90+-year-olds. The trend then continues into June with vaccinated 60-69-year-olds joining the highest mortality rate club.
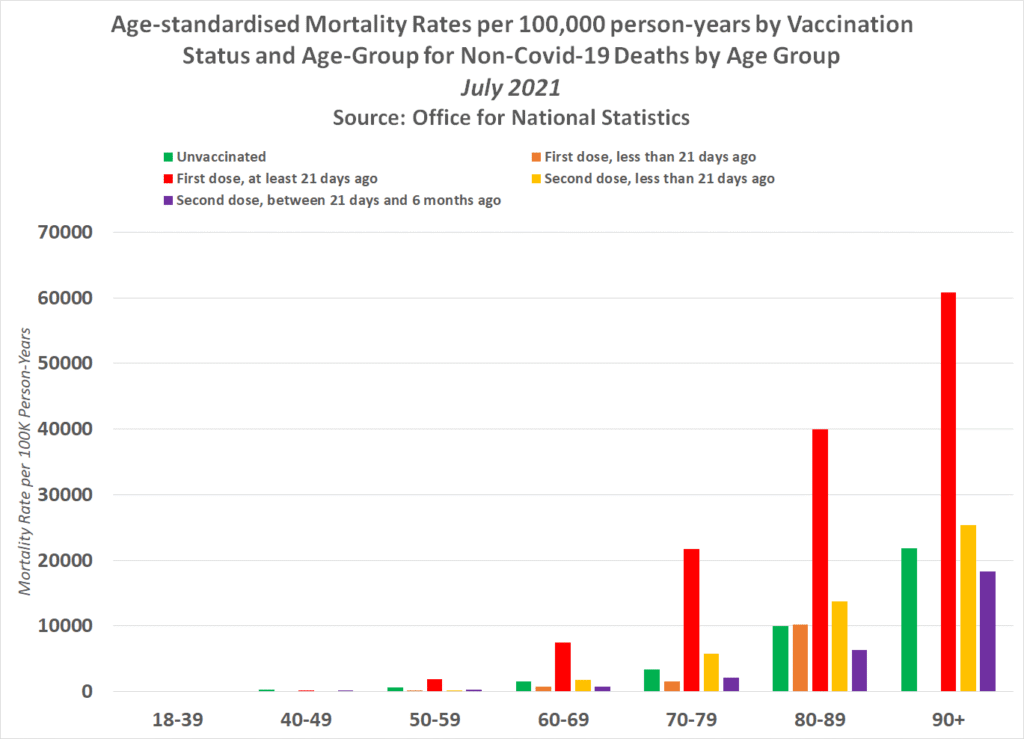
It then continues into July with the 50-59-year-olds joining the highest mortality rate club.
This data either indicates that the Covid-19 injections take approximately 5 months to completely decimate the immune system to the point where a person’s chances of dying of any cause are significantly increased, or it indicates that the Covid-19 injections are directly killing people in the thousands with a slow and painful death that takes on average 5 months to conclude.
The Expose Urgently Needs Your Help…
Can you please help to keep the lights on with The Expose’s honest, reliable, powerful and truthful journalism?
Your Government & Big Tech organisations
try to silence & shut down The Expose.
So we need your help to ensure
we can continue to bring you the
facts the mainstream refuses to.
The government does not fund us
to publish lies and propaganda on their
behalf like the Mainstream Media.
Instead, we rely solely on your support. So
please support us in our efforts to bring
you honest, reliable, investigative journalism
today. It’s secure, quick and easy.
Please choose your preferred method below to show your support.
Categories: Breaking News, Did You Know?, The Expose Blog, World News

szfsz
Hi, the link to ONS dataset says they made a correction. They say this was due to coding error. Personally, I don’t see how collecting data incorrectly could result in a coding error.
Keep up the good work Exposé.
The word ‘tallies’ is spelt ‘t a l l i e s’. An apostrophe is not needed when a word is pluralised. English is very tricky.
no, it isn’t. It is quite simply people are not being taught the rules. My fav. horrors are its, it’s
What’s happening to the world makes perfect sense once you understand (1) God gave us free will, and (2) the long history of the battle on earth between good and evil https://www.youtube.com/watch?v=IJqBaTBNM9k&t=151s
The U.K. Yellow Card Reporting system for ‘suspected’ adverse reactions (ADR’s) from the Covid-19 injections publish weekly (every 2 weeks during holiday periods) updates of reported Deaths ‘shortly after’ Covid-19 injections under the heading of Events with a Fatal Outcome.
Why are the official government published report updates of death following a Covid-19 injection limited to only ‘shortly after’?
Why such short parameters?
https://www.gov.uk/government/publications/coronavirus-covid-19-vaccine-adverse-reactions/coronavirus-vaccine-summary-of-yellow-card-reporting#annex-1-vaccine-analysis-print
Related article from across the Atlantic….
“Collateral Insights, UK ONS Edition
Proving jabs cause deaths in “vaccine” recipients. Thanks, UK ONS!”
https://live2fightanotherday.substack.com/p/collateral-insights-uk-ons-edition?s=r
Yes, can see vaxed persons are not protected in long term. Data described as age adjusted. Good. But is data adjusted for proportion of the population that is and is not vaxxed? e.g. It is expected that there would be greater incidence of covid infection/mortality etc among the vaxxed if the vaxxed population group is a larger group. Conversely, the smaller unvaxxed pop group will have lower incidence. Please explain or verify if info is otherwise adjusted. Thank you
The “weeks after jab” data are cumulative. For the sake of argument, say all Brits jab dutifully (unless they croak before getting their next potion). In this case, the population is always 100%, given enough time. The duration of the state of being 1week post jab to 11 weeks post jab should also not depend on the jab number (unless between 1st and 2nd jab if administered within 3 weeks). ONS did not go into details of what they treat as being a number of weeks post jab, of course.
Doesn’t the measurements by “100,000 person-years” account for the difference in population sizes between the jabbed and the non-jabbed?
Yes or it would not be like for like
Please read https://live2fightanotherday.substack.com/p/science-fiction-uk-ons-edition which has a different take on the same data. Then ask if still have questions – I will be happy to reply.
Per 100,000 age years. Equal measurement.
Please read https://live2fightanotherday.substack.com/p/science-fiction-uk-ons-edition that has a different take on the same data.
Also, observe the patterns of Covid and non-Covid deaths following the vaccination event by the age cohort at https://live2fightanotherday.substack.com/p/collateral-insights-uk-ons-edition
Statistics are too subjective. Biological maths such as Numerical Analysis is used to derive oatterns in large cinfusing data sets.
Rather than basic statistics, Numerical Analysis is needed for large conplex data sets and for specific Cause & Effect creating Differential Equations is more specific.
I’m keeping my logs simple with 21 friends/friends of friends with death/injury.
Next, I’ve started a log of Days with Symptoms for Vaccinated and Unvaccinated. Unvaccinated spend 1-3 days with symptoms whereas Vaccinated soend 3-7 days with symptoms.
Have a look at this substack , https://roundingtheearth.substack.com/?utm_source=%2Factivity&utm_medium=reader2-nav
Mathew doing a tremendous job.
Would love to see comparative data that would show the vaccines dangers in the United States
Question: The vaxxed are split into different groups. But isn’t the point more of unvaxxed V vaxxed in total, all times split into age groups (per 100,00). Then there is no cherry picking.
Shouldn’t we total the number of vaxxed groups to give a real comparison?
Thes graphs are confusing they look like the vaccinated are less prone to death or its the way the graphs are presented. Or I’m reading them wrong please would somebody simplify the results.
The first Covid-19 injection was administered in England on 8th December 2021, and here are the figures on mortality rates by vaccination status in the following 4 months –
Should it be December 2020?
Your alternative update on #COVID19 for 2022-06-06. During Pfizer trial, there were 28 baby deaths out of 36, while 230+ were not tracked. Rate spikes abound (blog, gab, tweet).
‘Unvaccinated’ includes those vaccinated within 21 days – so all the faster vaccine related deaths are included in that first bar. There is no other rationale for the unvaxxed to die at a greater rate from other causes – especially since the older and more vulnerabe (more likely to die) were vaccinated first – except perhaps from suicidal depression from understanding wtf was going on
https://www.hartgroup.org/data-shenanigans/
I question whether the Expose is genuine. They are not transparent in their personnel. They also seem from day one to be begging for money, which other publications do not. Try asking questions regarding who is behind the Expose and why they have not divulged it thus far.
Please correct text just before Table 2 of your article. “The first Covid-19 injection was administered in England on 8th December 2021, and here are the figures on mortality rates by vaccination status in the following 4 months” –
Vaccination started in the UK in Dec 2020 not Dec 2021
Thank you
David
first graph I have seen showing a somewhat long term statistic, 5 months out. What happens after 5 months, does the treat remain for a year, 2 years, until forever until it finally kills you? This is absolutely depopulation as outlined in the UN agenda 2030, Klause Schwab, Soros of WEF. Biden and his administration are complecit in this for standing aside and letting this happen. True to form Biden and his crime family are receiving their 10% just to sit back and watch. Last thing. You will not see politicians having a sudden death episode, they were all vaxxed with saline solution for political theater.